
One-off items came to the fore in interpreting OTP’s third-quarter result in Concorde’s analysis dated 13 November. For Hungarian retail investors, the issue is how far expectations about the share rest on sustainable earnings. We therefore compare two profit series from the bank’s report published on 11 November, using our own calculations and consistent periods.
In brief
- Reported and prorated profit show different growth paths.
- We compare the quarterly improvement with the same period a year earlier.
- For a forint-based investor, corporate currency effects and personal costs both matter.
Two profit measures, two comparisons
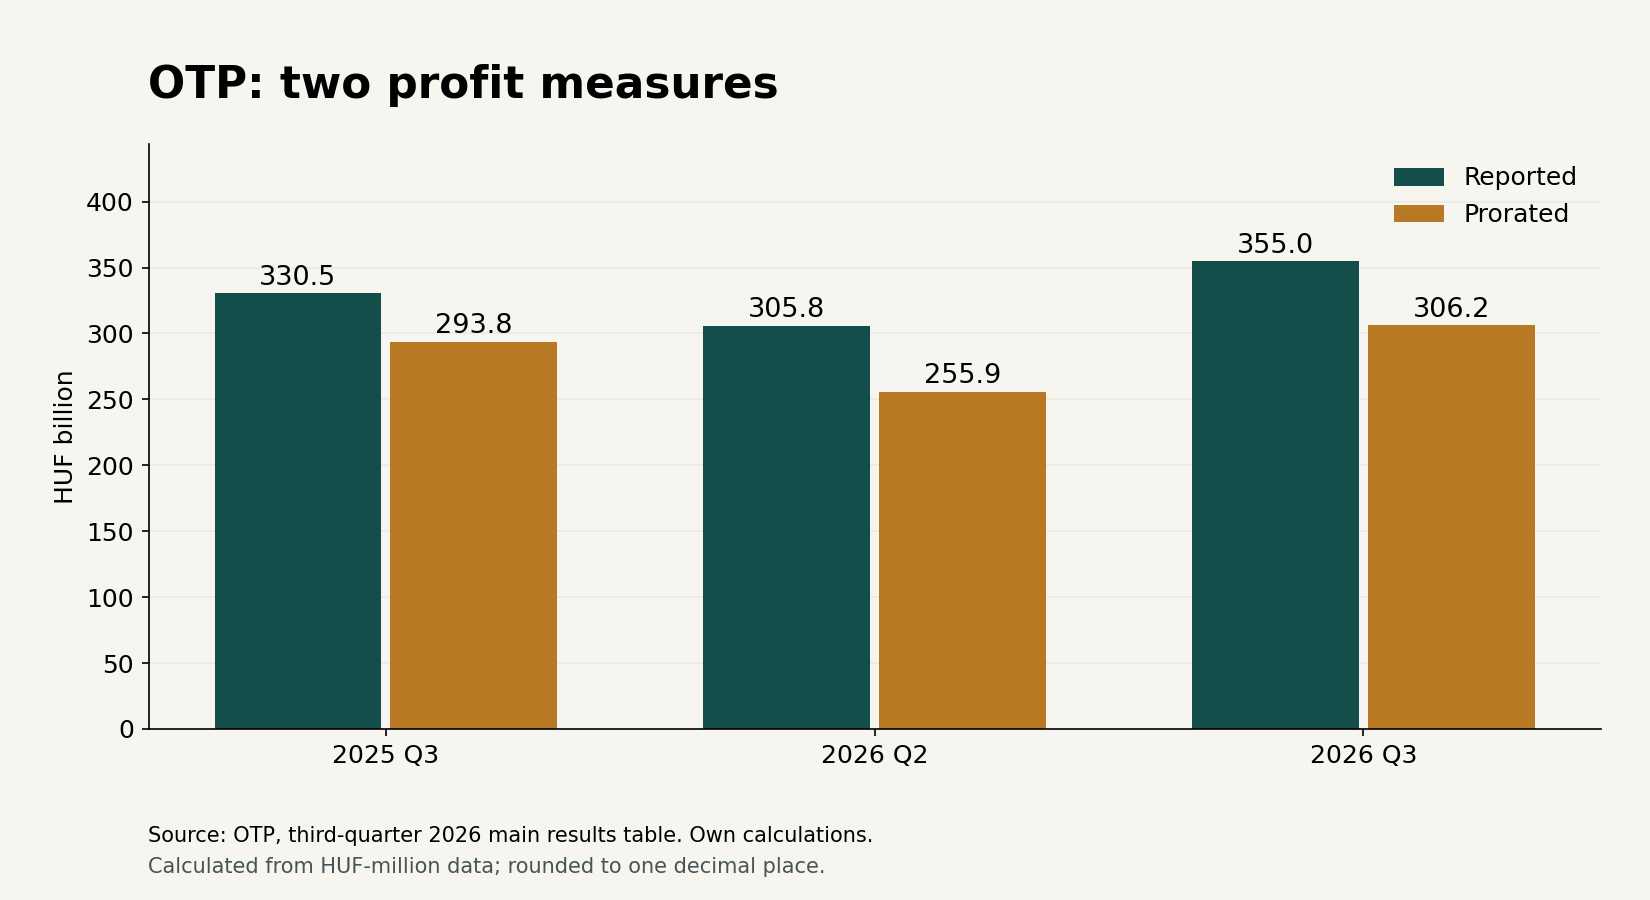
The main table in the bank’s income statement puts reported profit after tax at HUF 354,976 million, versus HUF 306,178 million for the adjusted measure using prorated recognition. The latter spreads special items booked in a single amount for the full year proportionately. This is an alternative comparison presented by the bank; the reported line remains the actual booked result.
The investor presentation discusses, among other items, a Slovenian tax effect and litigation provisions relating to Swiss-franc loans. Their signs, pre-tax or after-tax nature, and recognition periods can differ. They must not simply be added together as equivalent operating revenue. Our analysis uses the published profit lines rather than constructing a new banking earnings measure of our own definition.
One subheading in the Concorde analysis of 13 November reads: “Margin expansion may peak this year”. This is an analyst expectation that subsequent data can confirm or disprove. Margin concerns the profitability of interest-bearing business, whereas total profit describes a wider result. Costs, credit losses and tax effects must therefore be considered alongside it when assessing profitability.
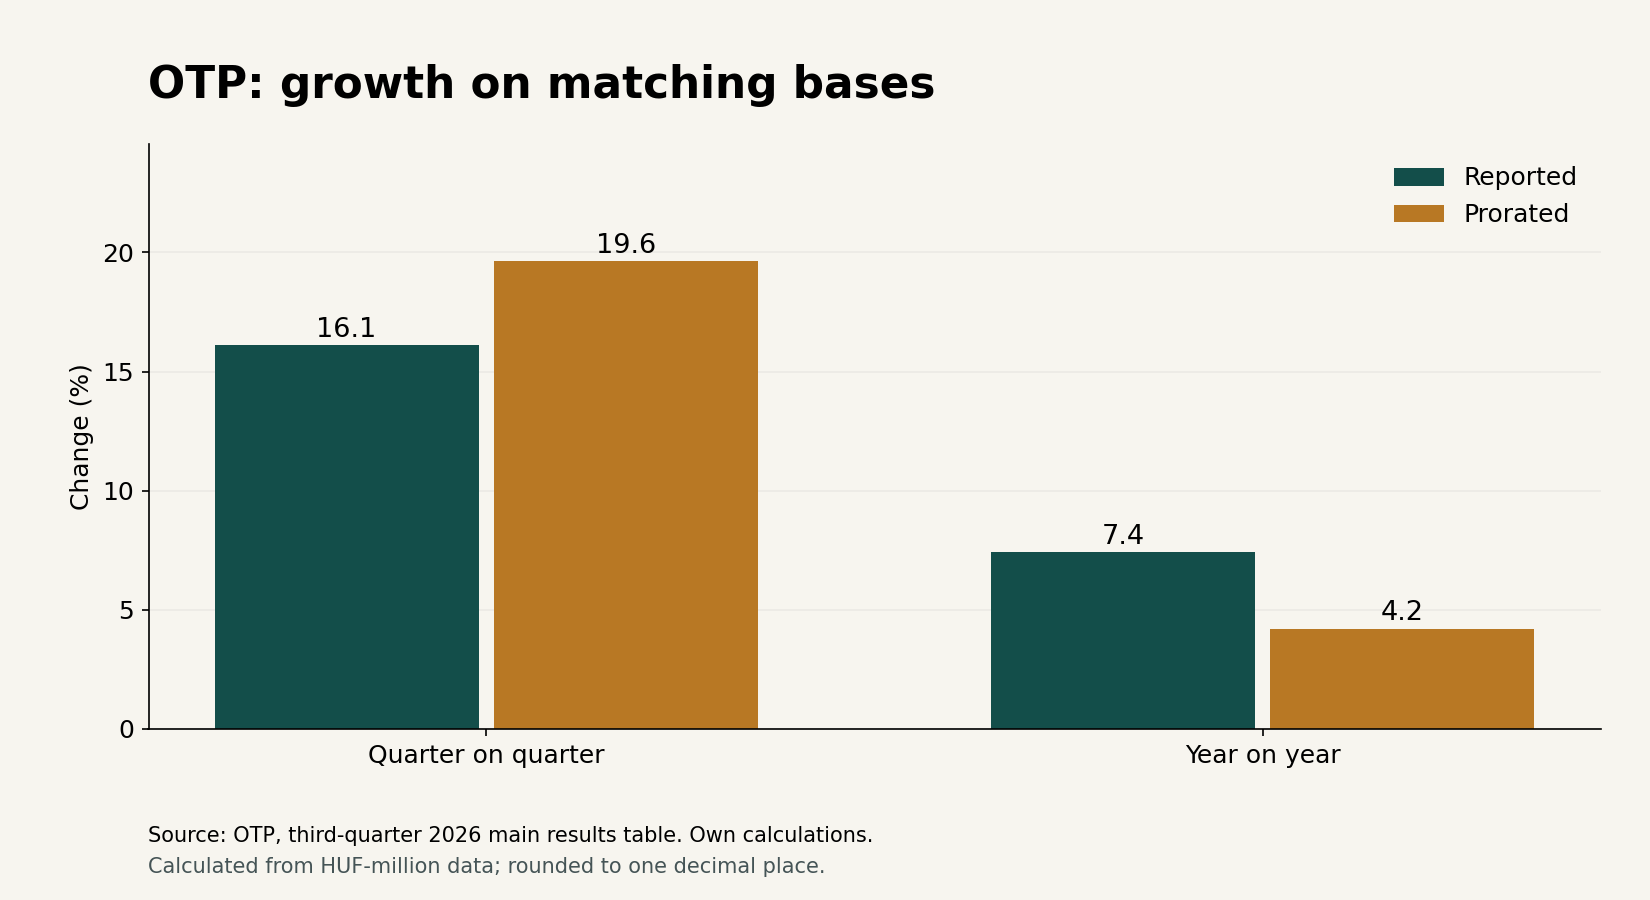
The first chart shows the three comparison periods for both series in the same unit. The second presents growth rates calculated from those figures. Together, the two views prevent a larger absolute amount from being automatically interpreted as faster underlying progress. We kept the order of the bars and the comparison bases consistent throughout.
Our calculation and its limits
In the source’s main table, reported profit was HUF 305,767 million in the preceding quarter and HUF 330,479 million in the equivalent quarter a year earlier. The corresponding bases for the prorated series are HUF 255,922 million and HUF 293,796 million. All figures are consolidated group results and form the basis of the charts. We calculated from the source table’s precision in millions, while displaying monetary amounts on a billions scale.
The formula is the same throughout: divide the current result by the selected base, subtract one, then multiply by one hundred. Reported profit consequently rose 16.1% quarter on quarter, and the prorated measure 19.6%. The corresponding year-on-year rates are 7.4% and 4.2%. We rounded rates to one decimal place, which can produce differences from the whole percentages in the company presentation. Earlier-period figures come from the same current table.
Subtracting the two current profit measures gives a difference of HUF 48,798 million. Rounded to one decimal place, this is 13.7% of reported profit. The gap measures the distance between accounting presentations, rather than a separate cash payment or future earnings that will automatically disappear. Its composition should be assessed alongside the bank’s explanatory notes.
The calculation is sensitive to the base. A lower preceding-quarter figure can produce a larger percentage improvement even when the annual picture is more modest. We therefore present quarterly and annual rates side by side. Selecting just one comparison could easily magnify the turnaround or conceal short-term improvement. There is no need to choose between the two horizons: they illuminate different questions.
Readers can reproduce the method in their own spreadsheet using the stated numerators and denominators. First align the unit and period, then perform the division. Rounding is best left until the final step. Starting from amounts already rounded to billions can produce a decimal percentage different from ours. The chart illustrates the result; full-precision data provide the basis for replication.
Investor scenarios and costs
In a favourable scenario, recurring revenue and lending activity support earnings while risk costs remain manageable. Operations could then offset the expiry of a positive one-off item. This is conditional interpretation, not a numerical promise about the bank’s next result. Subsequent statements and management’s detailed explanations could provide the evidence.
In an intermediate scenario, profit remains strong but margin growth moderates, and investors focus more closely on costs. In an adverse case, credit losses, operating expenditure or new regulatory burdens absorb part of the revenue improvement. These are not events that have already happened: they identify the conditions under which our assessment would change.
A Hungarian shareholder sees the investment’s price in forints, but translating the international banking group’s foreign earnings can also shape the reported figures. Corporate currency effects and currency-conversion costs in the investor’s own account are separate layers. Purchasing a forint-denominated share with forints does not necessarily involve exchanging money, while the group’s economic currency exposure remains.
Buy and sell commissions, possible account fees, the bid–ask spread and tax circumstances can also affect the investor’s net result. We do not attach specific provider charges without a verified offer. Minimum charges can be particularly important for small transactions, while recurring account costs matter over longer holding periods. They should be added up from the investor’s own contract over a consistent holding period.
The price paid for the share is a separate question when assessing earnings growth. The same profit can coexist with attractive or stretched valuations, depending on the persistence and growth the market prices in. Without a verified current share price, we do not calculate a valuation multiple here. Readers thus receive a comparable picture of operating performance, while the price and personal risk framework needed for an investment decision remain separate matters to examine. Clarifying profit lines is a preparatory step: it makes the questions more precise but does not replace reviewing the whole portfolio, considering liquidity needs and carefully assessing personal capacity to bear potential losses.
Our article on household securities savings provides the Hungarian investor background, while our Bavarian Nordic earnings analysis offers another corporate example of base effects. Margin, credit quality and the expiry of one-off items will be decisive comparisons in the next report. We provide no price target or personalised recommendation to buy or sell.
Original editorial content. Read our editorial standards.
Budapest Global Review: OTP: two profit measures show different growth rates. Budapest Global Review, 13 November 2026. https://globalreview.hu/en/cikk/otp-ket-profitmutato-negyedeves-elemzes-2026