
Constellation’s results released on 9 November show quarterly earnings attributable to shareholders growing faster than earnings per share. For a Hungarian retail investor, that difference matters: what counts is the portion of corporate performance attached to their ownership interest, after which exchange rates and costs also change its value in forints.
According to the company announcement and the exhibit available at the SEC, third-quarter net income was USD 1835 million in 2026 and USD 930 million in 2025; diluted earnings per share were USD 5.19 and USD 2.97 respectively. January’s Calpine acquisition changed the corporate perimeter being compared. Chief financial officer Shane Smith spoke of “sustained earnings growth”; this is management’s expectation, which subsequent performance must substantiate.
In brief
- Different growth rates for profit and earnings per share also warrant examining the denominator.
- Comparing a company enlarged through acquisition requires particular care; total growth cannot be described as organic.
- Exchange rates and costs add separate calculation layers to an investor’s result measured in forints.
The denominator matters too
Our calculations put net income growth at 97.31% and diluted earnings per share growth at 74.75%. In each case, the formula is the new value divided by the base value, minus one, expressed as a percentage. The first chart compares the same quarter year on year, without a scaling trick.
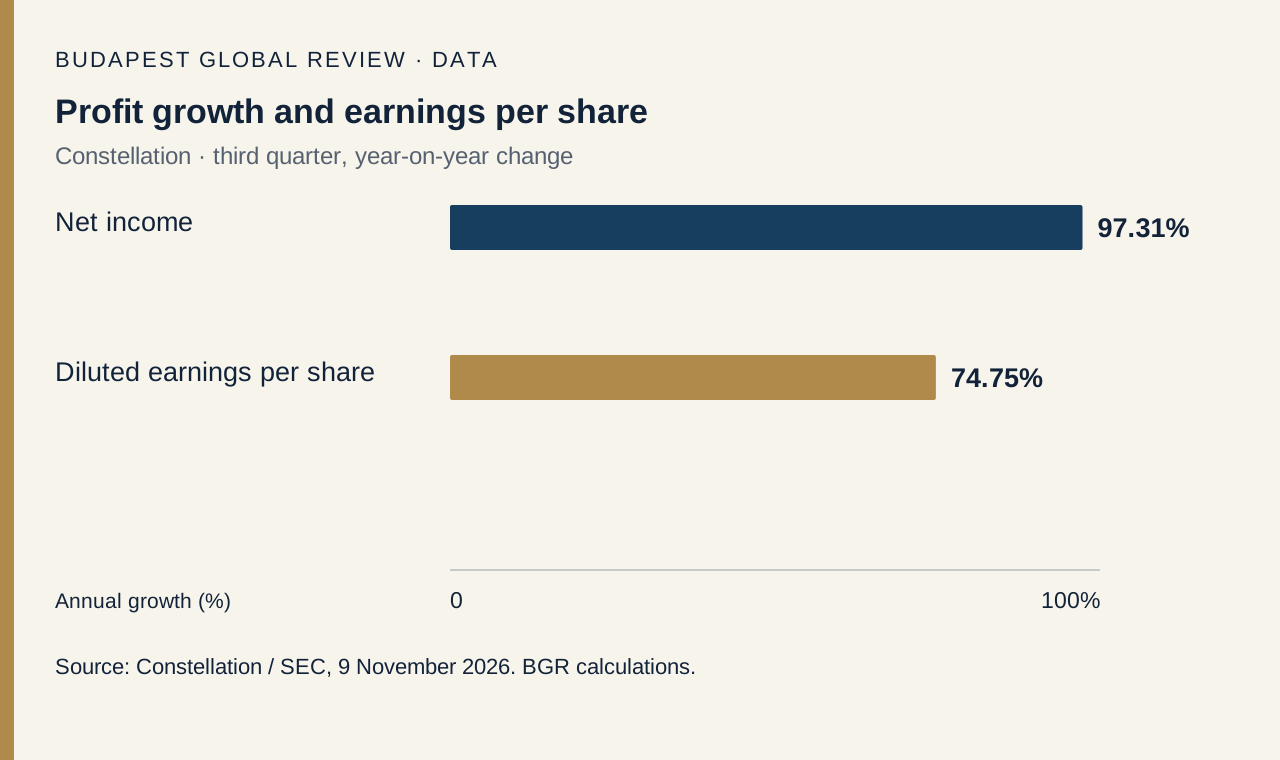
The 22.56 percentage point gap between the changes is not missing money. Mathematically, it can also arise because profit is spread across more shares. Dividing the published rounded earnings amounts by their per-share values implies approximately 12.91% more shares in the earnings calculation. This is a reverse-calculated approximation, not a determination of the company’s exact share count; it also incorporates rounding effects.
An investor can therefore ask two different questions. Did the earnings generated by the company rise, and how much did performance per ownership unit improve? An acquisition may enlarge the business while its financing affects the owner’s interest. A simple ranking of percentage growth rates conceals these differences.
For a comparison of periods before and after an acquisition, a verifiable statement prepared on a like-for-like basis would therefore be the strongest supplement. We do not manufacture an estimate to replace missing details. We separate growth demonstrable from the published figures from the question of how much can be repeated in the next period.
In our Berkshire example of earnings components, we also examined the structure of the accounts. The similarity is methodological: figures from different business models do not provide a direct valuation ranking. The origins, persistence and conversion into cash flow of earnings jointly help assess their quality.
The outcome can differ in forints
The second chart uses a hypothetical example. The share price change in USD is +10% in every case, and the model’s total cost, charged to the end-period value, is 1%. USD/HUF changes by −5%, 0% and +5% respectively. These are illustrative inputs, not current exchange rates, provider fees or market forecasts.
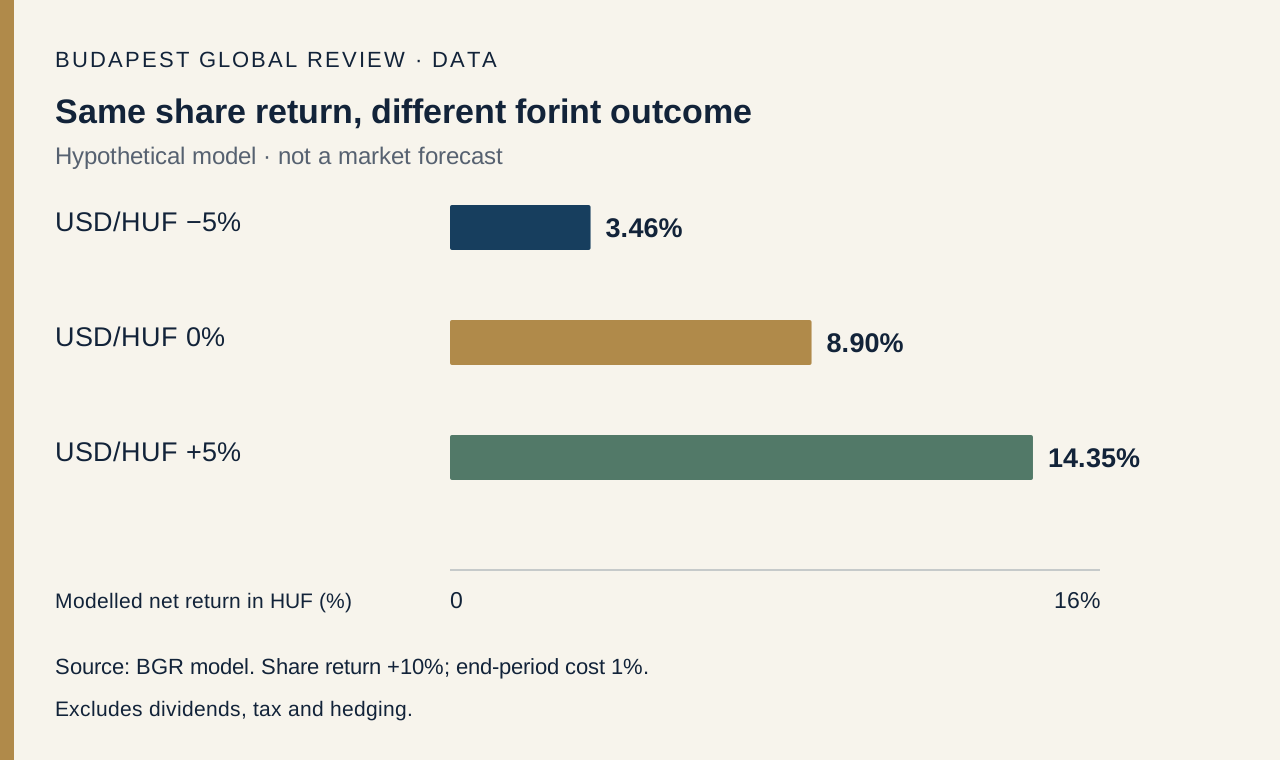
The reproducible formula is 1.10 × currency factor × 0.99 − 1. The currency factors are 0.95, 1.00 and 1.05 in that order. This produces modelled forint returns of 3.46%, 8.90% and 14.35%, rounded to two decimal places. Even with an unchanged currency rate, less remains than the gross share price gain, because the cost reduces the end-period value.
A negative USD/HUF change means that the same USD buys fewer forints. Alongside a rising share price, this holds back the return expressed in forints. The opposite currency move supports it. Because the factors multiply, simply adding the percentages would produce an inaccurate result.
A real account may have a different cost structure. Purchase and sale commissions, the currency conversion spread, any holding charge and the timing of taxation may differ from the example. The model excludes dividends, tax and hedging. An actual net result requires the investor’s account statement and applicable fee schedule.
When considering currency risk, it is useful to examine the currencies of both the investment and subsequent spending. Money intended for an expense in forints can carry a different currency exposure from an amount to be spent later in USD. No personalised allocation or transaction instruction can be derived without the investor’s circumstances.
Prospects and the evidence needed
In a favourable scenario, the enlarged business generates sustained earnings and performance per share also improves. In an adverse scenario, financing and operating burdens or weaker revenue absorb the expected benefit. These are analytical possibilities; the information available does not allow us to quantify their probabilities.
Reporting earnings and judging a share’s attractiveness are different tasks. Without a verified current purchase price, we do not calculate a price/earnings ratio or call the stock cheap or expensive. The same corporate improvement can produce different investment outcomes depending on the price at which someone became an owner.
Our analysis of Moderna’s financing illustrated in another sector why earnings and financing should be read together. For Constellation too, it is necessary to track separately the cost and ownership consequences of securing the resources required for planned development.
The calculation’s sensitivity deserves further scrutiny. Quarterly earnings should not simply be multiplied into an annual figure: that would require assuming that every material condition of the period repeats unchanged. We also draw no standalone cash-flow conclusion from reported profit, because recognition and cash movements can occur at different times.
A traceable investor note can place observed facts, calculated metrics and associated expectations on separate lines. This makes it possible later to see whether an error came from the input, the calculation or the assumption about the future. The method is particularly useful when an acquisition changes a business’s size.
To compare risks, it is useful to think through the favourable example with a loss-making share price path as well. The chart isolates currency effects with a fixed share price move, so it provides no information about the upper limit of possible losses. Without preserving the model’s boundaries, even an accurately calculated percentage can become a misleading decision aid.
The next specific event is the earnings call scheduled for 9 November at 15:00 Budapest time. Management’s explanations should be examined for the relationship between comparable business performance, financing burdens and earnings per share. The charts are our own: the first uses reported earnings data, and the second the assumptions stated above.
Original editorial content. Read our editorial standards.
Budapest Global Review: Constellation: share count matters behind the profit jump. Budapest Global Review, 9 November 2026. https://globalreview.hu/en/cikk/constellation-nyereseg-reszveny-forint-2026