
Moderna's third-quarter operating result moved from loss to profit: higher revenue and lower costs together improved the figures. For a Hungarian retail investor, however, two separate questions remain: how durable the operating improvement is, and how the forint result of a USD investment might develop. Using our own calculations, we separate the effects of operations and financing in the company data released on November 6.
In brief
- Quarterly operating profit improved by 390 million USD; revenue contributed 297 million USD and costs 93 million USD.
- Of 3000 million USD in bond financing, 2628 million USD remained after the listed deductions; this is financing money, not product sales.
- The company holds an Analyst Day on November 12; revenue durability and the conditions for cash conversion are the questions to follow.
The arithmetic of the turnaround
According to the company earnings release filed with the SEC, revenue for the quarter ending in September was 1313 million USD, versus 1016 million USD a year earlier. Total operating expenses fell from 1276 million USD to 1183 million USD. Operating income thus moved from minus 260 million USD to plus 130 million USD. Net income was a profit of 162 million USD, following a loss of 200 million USD.
These are different levels of earnings. Operating income can be traced through the difference between revenue and operating expenses; additional financial and tax items contribute to net income. Confusing the two would give an inaccurate account of where the company's performance improved. Chief Financial Officer Jamey Mock wrote in his own summary: “we were profitable”. The Hungarian translation reproduces this short original statement.
Our method takes differences between the reported figures, rounded to millions of USD. Revenue changed by 1313 minus 1016, or 297 million USD. Cost savings were 1276 minus 1183, or 93 million USD. Their sum is 390 million USD, exactly the improvement in operating income. In this accounting decomposition, the revenue contribution is 297 divided by 390, or 76.15%. This is a decomposition, not evidence that any single business cause had an exclusive effect.
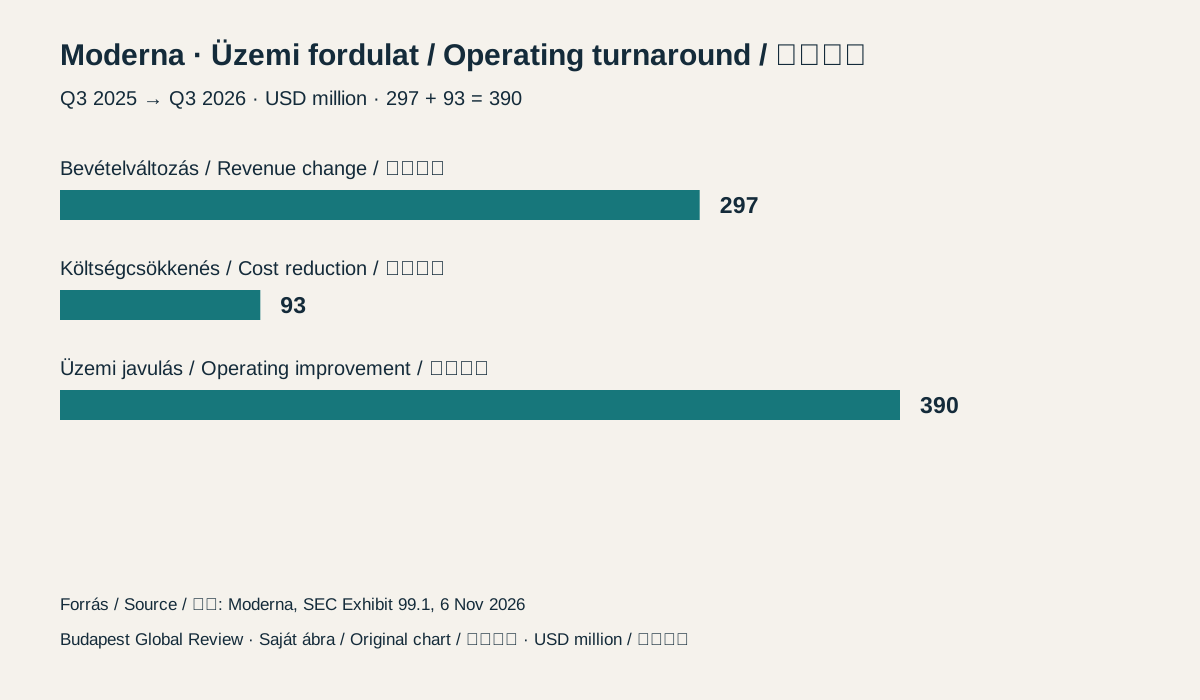
Our calculated revenue growth is 29.23%. Operating margin is 130 divided by 1313, or 9.90%, compared with a base of minus 25.59%. The difference is 35.49 percentage points. When a loss turns into a profit, this comparison is more intelligible than a percentage earnings increase calculated from a negative base. The chart therefore shows absolute amounts, and every value refers to the same quarterly comparison.
Establishing the improvement's durability requires further periods. One quarter cannot reveal how many orders will recur, when customers will pay, or what later expenditure will become necessary. Our conclusion is consequently narrow: the quarter examined improved at the operating level, but we do not infer an unchanged future earnings path. Subsequent company releases can provide new evidence for the investment narrative.
Cash and financing
The financing transaction must be treated separately when analysing liquidity. The company's quarterly report lists gross convertible-note financing of 3000 million USD, issuance costs of 43 million USD and 329 million USD spent on capped call transactions. Our subtraction is 3000 minus 43 minus 329, or 2628 million USD. This is the amount remaining from the transaction; reconciling the company's total cash movement requires accounting for all other cash flows as well.
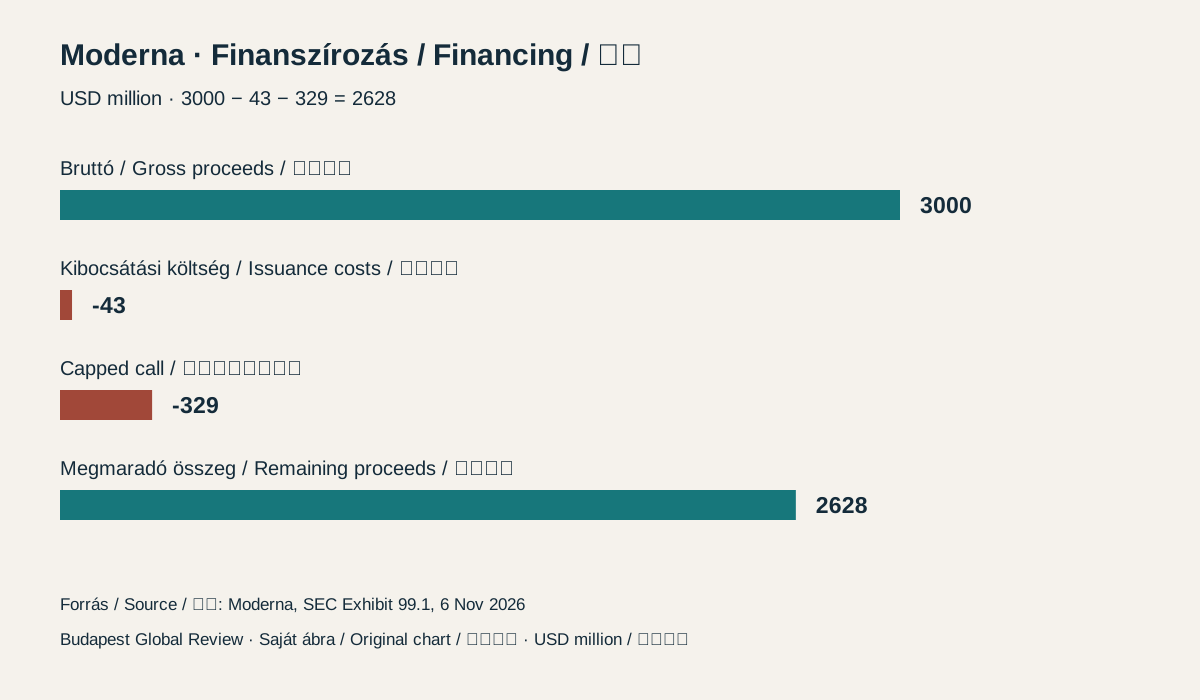
The deductions total 372 million USD, or 12.40% of gross financing. Calling the entire amount a fee would be wrong because the portion spent on the hedging transaction has a different economic substance. The chart keeps issuance costs and capped calls on separate lines. The calculation illustrates the cash side of the transaction; it does not estimate the bond's entire future cost or the ultimate extent of shareholder dilution.
For Hungarian readers, the essential distinction is that financing decisions can also strengthen cash resources. Money received from products, new funding and accounting profit require separate examination. In our decomposition of Berkshire's earnings we likewise separated earnings components; our analysis of MOL's one-off items offers another example of clarifying a comparison.
Revenue timing, the subsequent path of operating expenditure and the shareholder consequences of financing deserve separate consideration as risks. In a favourable scenario, the operating improvement recurs and receivables turn into cash. In an adverse scenario, sales or collection timing deteriorates while expenditure persists. These are conditional assessment frameworks, not probabilities or numerical forecasts provided by the company.
Forint returns and the next event
We illustrate currency effects solely through a hypothetical scenario, without asserting any actual exchange rate or share price. If the USD value of the shares rose by 10% while the USD's forint value fell by 5%, the product would be 1.10 multiplied by 0.95. Subtracting one gives a forint change of 4.50% before costs. Simply subtracting the two percentages would be inaccurate because the effects multiply.
If, in the same example, total costs are modelled as 1% of final value, the formula is 0.99 multiplied by 1.10 and 0.95, then minus one. The result rounds to 3.46%. This is an assumed cost, not a provider's fee quotation. Actual commission, currency conversion spread, account costs and taxation depend on the individual account's terms; the example contains no personalised buying or selling conclusion.
Margins and scenarios are rounded to two decimal places without intermediate rounding. Since company amounts are reported to the nearest million, our calculations are constrained by that input precision. The charts are our own work and identify their source data and operations. The archival building photograph identifies the company; it is not on-site documentation of the earnings announcement.
A limitation of the decomposition is its use of aggregate financial statement lines. It does not distinguish every product, country or contract, and does not include an investor's acquisition price. We therefore do not derive a price target from the operating improvement. The comparison helps readers look for consistent concepts in releases and recognise when a new figure concerns a different period.
The next verified event is the November 12 Analyst Day, announced by the company in its earnings release. Specific company statements about repeatability of operating improvement, use of financing and collections should then be compared with the current report. This completed analysis is based on the November 6 release; later developments can be added only with a new, verified source.
Original editorial content. Read our editorial standards.
Budapest Global Review: Moderna: operating turnaround and billion-dollar financing. Budapest Global Review, 6 November 2026. https://globalreview.hu/en/cikk/moderna-uzemi-fordulat-finanszirozas-2026