
In its report published on November 10, Protalix posted revenue of USD 75.571 million for the first nine months, compared with USD 43.622 million in the same period a year earlier. For Hungarian retail investors, the composition of growth matters at least as much as the percentage increase: one-off revenue, stock risk and the result of conversion into HUF require separate examination.
According to the company’s earnings release, this year’s figure includes a USD 25 million milestone payment from Chiesi. It was recognised in the first quarter. The newly published cumulative figure therefore includes an item whose recurrence does not follow simply from continued product sales.
In brief
- Total revenue grew faster than revenue from product sales.
- Subtracting the one-off item provides an illustration, not a company performance metric.
- Exchange rates and costs also shape investment results measured in HUF.
The composition of growth
In the unaudited tables of the quarterly report, revenue from goods rose from USD 43.108 million to USD 49.081 million. Revenue from licences and research services was USD 26.490 million, versus USD 0.514 million. Both comparisons cover the nine months ended September 30, using figures for 2025 and 2026.
Our calculation puts total growth at 73.24% and product-sales growth at 13.86%. The method is identical: divide the current figure by the prior-year figure, subtract one, then convert into a percentage. The difference between the rates shows why total revenue alone provides an incomplete assessment of business performance.
The revenue increase was USD 31.949 million; dividing the milestone payment by that increase gives 78.25%. This is an arithmetic decomposition of the increase. It does not assert that all costs, taxes or cash movements would have remained unchanged without the one-off amount.
Subtracting that item from this year’s total revenue leaves USD 50.571 million, representing growth of 15.93% against last year’s total revenue. This illustrative result is our calculation, not an adjusted metric published by the company; the remainder may also contain revenues with different timing or conditions.
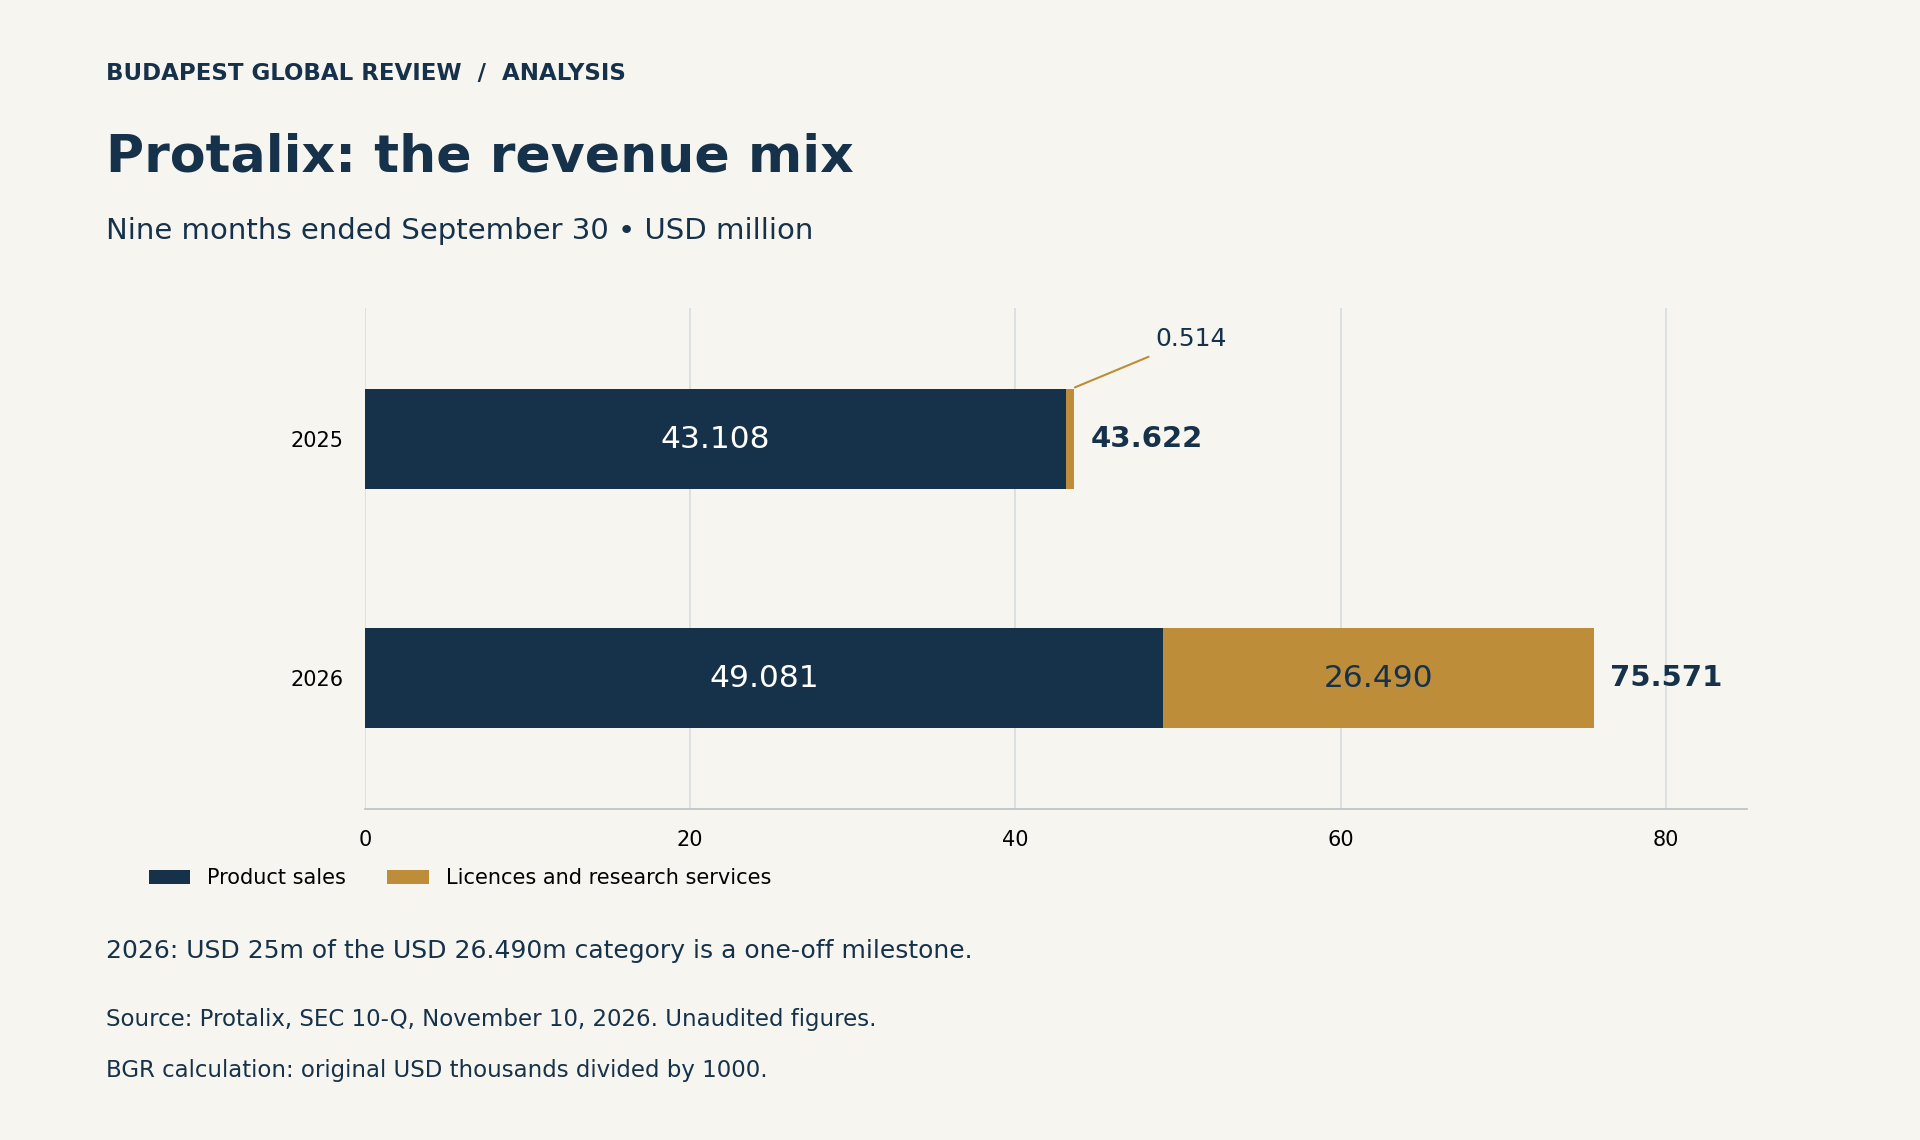
The first chart shows the reporting categories in USD millions on a scale starting at zero. We divided the original figures, reported in thousands of USD, by a thousand. The milestone payment sits within the licence and research category; it is not a separate third revenue item added to the chart.
For Hungarian readers, this offers a general lesson in interpreting financial reports. Our analysis of Moderna’s financing likewise highlighted the value of examining operations and financing separately. Because the companies have different business models, we do not use this comparison to establish a direct valuation ranking.
Reserves, outlook and uncertainty
In the earnings release, chief executive Dror Bashan highlighted “cash and deposits” of USD 48.5 million. This is the company’s rounded presentation of its end-September position. Cash is measured at a point in time, whereas revenue measures performance over a period; adding the two does not produce a meaningful annual performance measure.
The analytical question is how far operations in subsequent periods replenish the available resources. Research funding, the timing of customer receipts and future payments jointly determine financial flexibility. A favourable balance-sheet date does not permanently fix future funding needs.
In a favourable scenario, expanding recurring sales and manageable spending growth could improve the sustainability of operations. In an adverse case, changes in revenue timing or rising development expenditure could narrow the reserve. These are conditional analytical possibilities, not company forecasts or events that have already occurred.
We do not derive a price target from the report. Beyond the current stock price, that would require grounded estimates of future cash flows, share count, risks and the required return. The verified financial figures presented here would supply only part of such a valuation.
Both primary documents come from the same issuer. Matching figures support consistency between documents, rather than providing independent external evidence for business prospects. This distinction is particularly relevant when reading management statements about the future.
The denominator also matters when interpreting growth percentages. With a low comparison base, a relatively small absolute increase can produce a striking growth rate. It is therefore useful to examine the absolute change alongside the weight of each category, then consider which contractual or sales conditions are necessary for revenue to recur.
There is no mechanical correspondence between liquid reserves and the value of the stock. Cash must also fund operations, existing commitments and development. The analysis therefore focuses on revenue quality, rather than distributing the entire cash balance among shareholders.
HUF results and a reproducible method
PLX shares, listed on NYSE American, trade in USD. A Hungarian investor’s wealth measured in HUF may therefore reflect changes in USD/HUF alongside the stock’s USD return. The following example uses fixed assumptions; it is neither a current exchange-rate quote, past performance nor a promised return.
Assume the stock earns 8% in USD, with total costs equal to 1% of the final converted value. In three alternatives, the USD’s HUF value falls by 5%, stays unchanged or rises by 5%. The calculation excludes dividends, tax and currency hedging.
The formula multiplies the stock-value factor by the currency-value factor and the after-cost factor, then subtracts the starting value. Numerically, the unchanged-currency case is 1.08 × 1.00 × 0.99; subtracting one leaves 6.92%. With a weaker USD, the HUF result is 1.57%; when it strengthens, it is 12.27%, rounded to two decimal places.
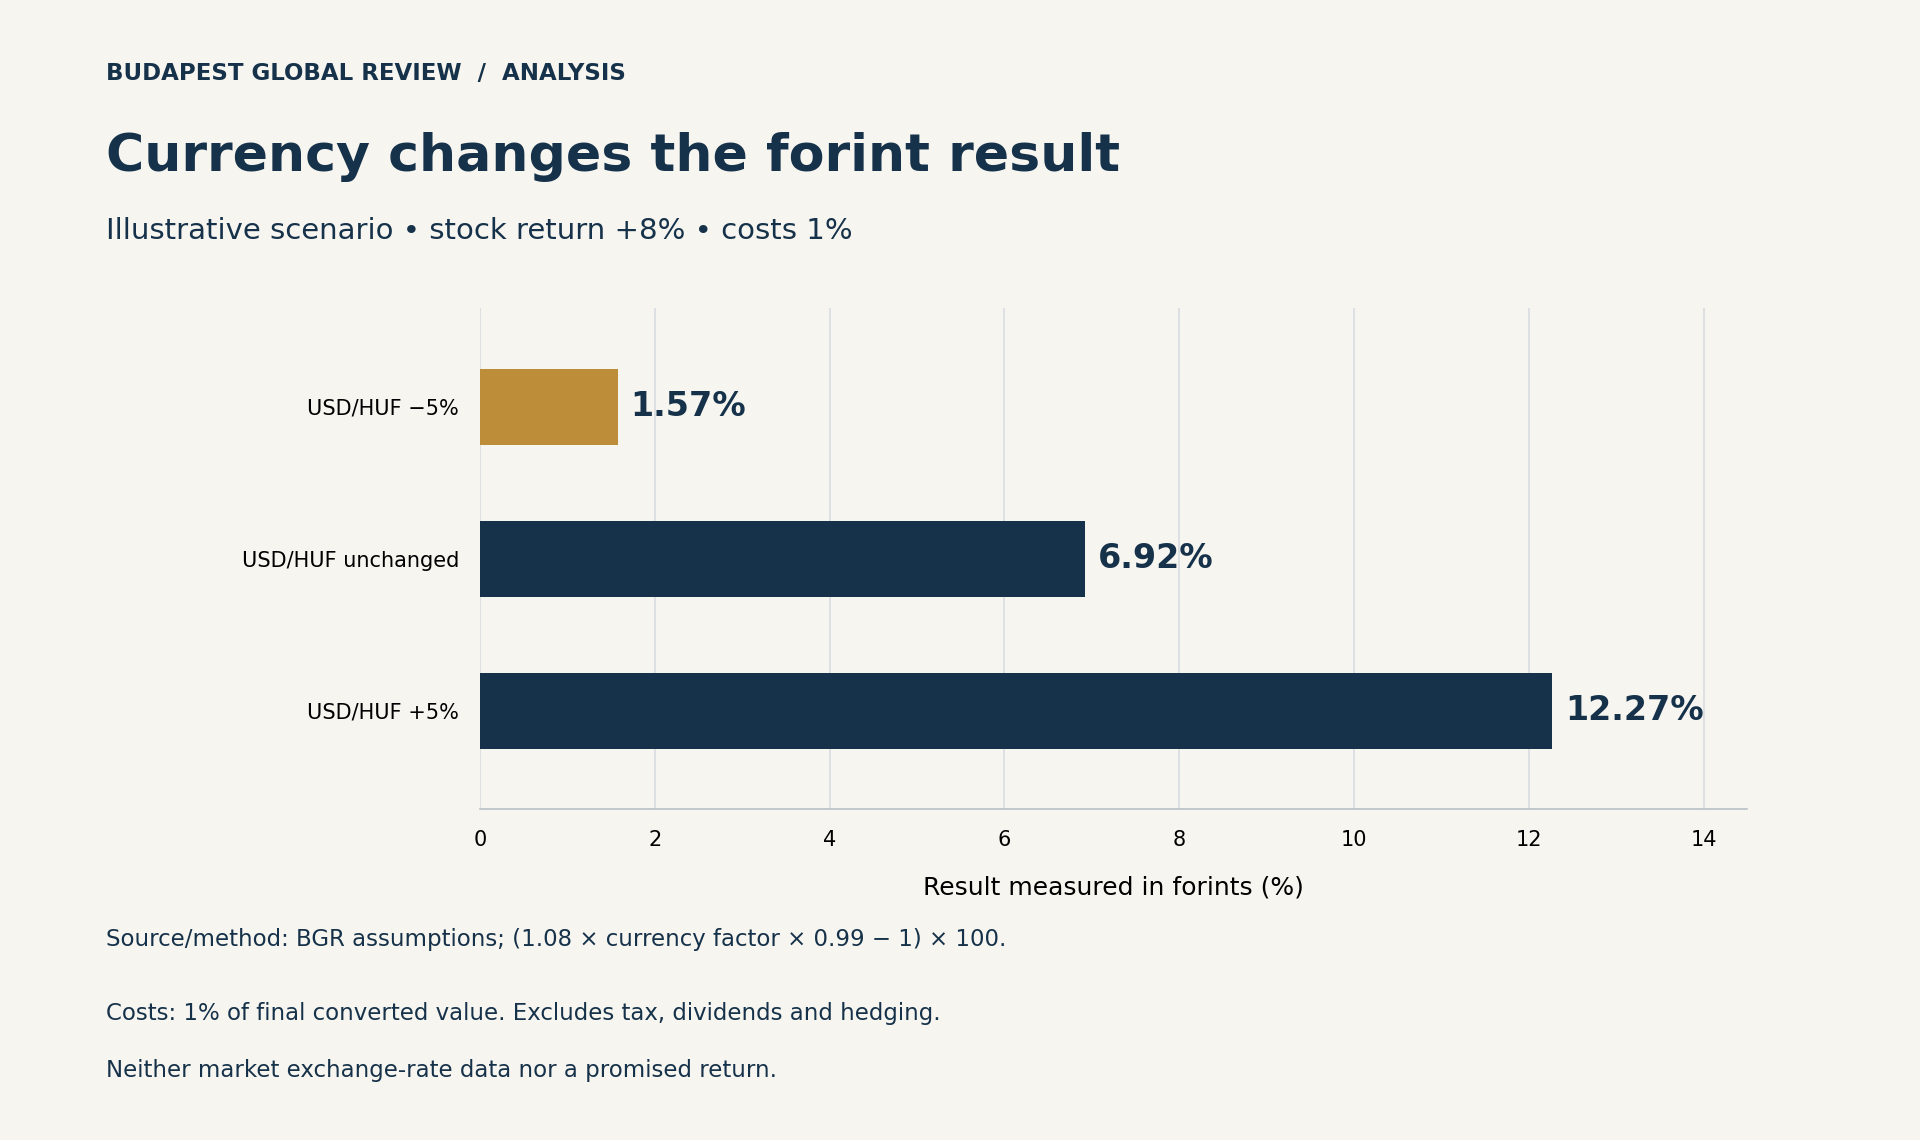
The second chart depicts only these original scenarios. Its source is the assumptions and multiplication formula above, not an external exchange-rate series. Actual provider fees may differ: a fixed minimum charge and a conversion spread require a separate calculation, particularly for smaller investments.
Our earlier Constellation analysis examined the same conversion into HUF in a different corporate setting. A comparable analytical framework does not make different stocks equally risky and does not determine a personalised buy or sell decision.
In the next company report, sales excluding the milestone payment, cash receipts and expenditure will merit attention together. The new results make the composition of revenue clearer; a sustainable growth rate can be assessed reliably only using further comparable reporting periods.
Original editorial content. Read our editorial standards.
Budapest Global Review: Protalix: a one-off payment boosted revenue growth. Budapest Global Review, 10 November 2026. https://globalreview.hu/en/cikk/protalix-bevetel-merfoldko-forint-2026