
In brief
- Siemens Energy improved its annual profit margin and earnings per share.
- Our calculation distinguishes percentage growth from a percentage-point difference.
- For Hungarian investors, the stock, EUR and costs jointly shape the result.
What do the newly published figures say?
Siemens Energy’s annual results presented on 11 November give Hungarian retail investors watching foreign shares two separate tasks: interpret the company’s operations, then assess their own exposure in forints. This analysis checks the numerical basis of the first task and illustrates the second with a conditional example; it uses no current share price.
According to the company’s release, the profit margin before special items reached 12.4 percent in fiscal 2026, which ended on 30 September, after 6.0 percent in 2025. Basic earnings per share were 4.44 EUR, compared with 1.63 EUR. We treat the company’s own measure and per-share earnings as distinct concepts.
“We delivered on our commitments” was how chief executive Christian Bruch put it in the release. That is management’s assessment. Investors need to examine the operating processes behind the improvement, its repeatability and what may remain for shareholders after future funding needs.
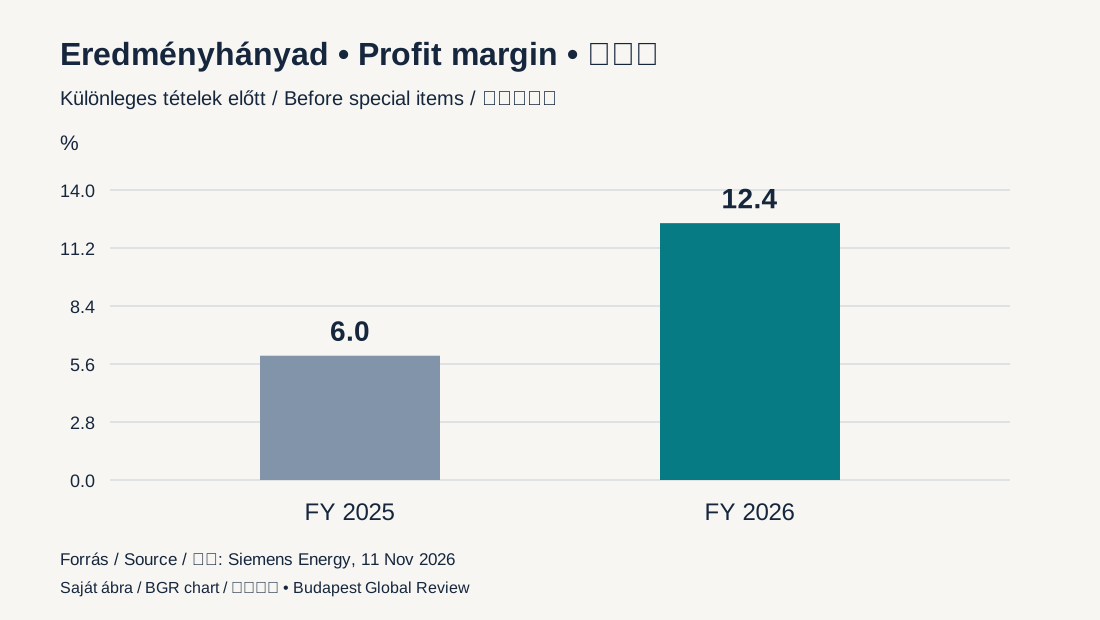
Our first chart shows both margins on a common axis starting at zero. The difference is 6.4 percentage points: we subtract the previous percentage measure from the current one. We do not call this the same amount of percentage growth, because percentage points express a difference, while a growth rate is a ratio.
The underlying figures cover the full fiscal year, not the calendar year’s first nine months. The detailed earnings release treats quarterly and annual data separately. When taking a figure from a short news report, first identify its period and exact definition; comparison comes afterwards.
Our interpretation is that the improved margin indicates more profit per unit of revenue under that particular measure. This does not establish an equivalent share return. The price may also reflect investors’ earlier expectations, views about the future and the price of risk.
Calculation and limits of interpretation
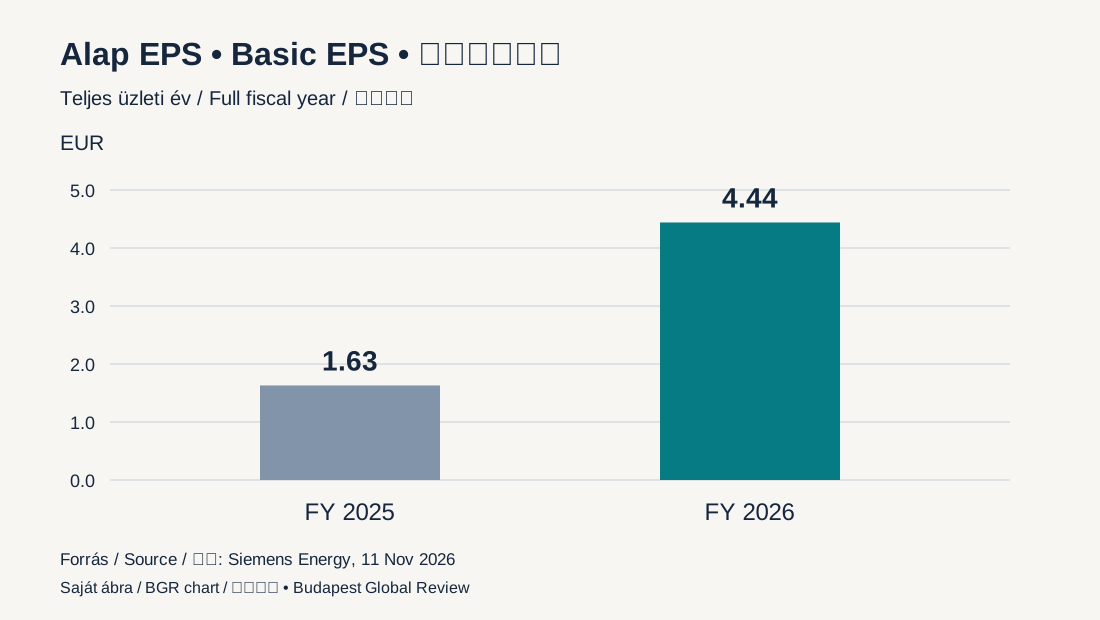
Our second chart shows basic earnings per share in EUR, on the same annual comparison basis. We calculate growth of 172.39 percent. The reproducible formula divides the current value by the previous value, subtracts one and multiplies by one hundred. Rounding to two decimal places happens only at the end.
Reading a large growth rate requires seeing the starting level too. The same absolute improvement produces a larger percentage from a lower base. This is a general arithmetic relationship, so we show both underlying values instead of highlighting the percentage alone. The ratio supplies no independent evidence of repeatability.
Improvement in both the margin and earnings per share can give a more consistent picture than a single headline measure. The two figures are not independent economic evidence, however: they summarise different earnings lines at the same company. Share count can also influence per-share earnings, so a complete breakdown of operating performance requires additional data.
The next layer of examination is cash flow. Profit should not be substituted for freely spendable cash: collection, advances, investment and liability timing can differ from earnings recognition. These charts compare profit measures; they do not calculate an amount available for distribution to an individual shareholder.
Our analysis of MOL’s special items and Berkshire earnings breakdown apply a similar reading method to different business models. These are methodological connections, not direct company rankings. Margins in different industries may embody different capital needs and risks.
The analysis has a deliberate limit: without a current, verified share price, we give no valuation multiple or target price. Corporate earnings growth and investment attractiveness are different questions. Even shares in a well-performing business can cause losses if the purchase price assumes an overly optimistic future.
We preserve the underlying figures at their original precision. Chart labels identify the fiscal year and unit so readers do not confuse percentages with monetary amounts. We do not average the two measures because they have different denominators. The documented calculation aims to enable verification; assessing future performance requires comparing later reports by the same method while tracking any changes in definitions. Different definitions must be identified separately.
The result can differ in forints
For a Hungarian saver, an EUR-denominated share and changes in the euro’s forint value matter together. Investor.gov’s guidance also distinguishes currency effects and international investing costs. Actual settlement for a Hungarian customer requires their provider’s fees and conversion terms.
In our illustrative example, which is not a forecast, the stock rises 10 percent in euros while the euro’s forint value falls 5 percent. The gross return in forints is then 4.5 percent: multiply the return factors and subtract one. This is neither an observed Siemens Energy return nor live currency data.
Trading, conversion and possible account charges can further alter the example’s gross result. Fees must be converted to the same currency and holding period. We do not calculate individual after-tax returns without personal circumstances and verified settlement details.
In a favourable scenario, operating improvement persists, order execution remains disciplined and new capacity provides adequate returns. In an adverse case, costs, execution problems or changing demand pressure earnings. These are conditional analytical paths, not probability-weighted corporate forecasts.
Concentration also deserves separate examination. An energy company’s different businesses may share industry or financing exposures. Revenue from several activities therefore does not replace reviewing an investor’s entire portfolio. This earnings release cannot decide how much risk that person should take.
The company’s calendar schedules the annual report for 10 December. Reviewing detailed reconciliations, risks and cash-flow lines there will be the next verifiable step. The present earnings release provides a starting point, but does not conclude the valuation.
Both charts and the currency example can be recalculated independently. Readers can compare company figures with the sources and their own exposure with account statements and fee schedules. This is general financial analysis without personalised advice to buy or sell.
Original editorial content. Read our editorial standards.
Budapest Global Review: Siemens Energy: reading the improved annual profit margin. Budapest Global Review, 11 November 2026. https://globalreview.hu/en/cikk/siemens-energy-eves-eredmenyhanyad-2026