
Samsung Electronics’ results announced on 29 October show a highly concentrated profit structure. For a Hungarian retail investor, it is therefore useful to understand which division generates earnings behind the corporate name, and in which currency their own return arises. Corporate profit, changes in the share price and wealth measured in forints are three separate measurements; the calculations below distinguish them.
In brief
- The DS division, which includes semiconductors, dominates operating profit.
- Our charts measure the group and its division using separate denominators.
- Hypothetical currency and cost effects can reverse a share-price return.
What do the quarterly figures measure?
Samsung’s original announcement concerns the quarter ended 30 September. Every amount in the data below is in trillion South Korean won, or KRW. The group figure is consolidated; DS forms part of it. Adding the group and its division would double-count.
- Samsung group: revenue 195.3; operating profit 107.4.
- DS division: revenue 147.1; operating profit 106.5.
The Herald Business report separately confirms these figures. In its description of the memory market, the company discusses performance amid “capacity constraints”; the Hungarian and Chinese quotation is our translation of a corporate assessment. The announcement date and the end of the reporting period differ: the news describes past operations, not a completed result for the following quarter.
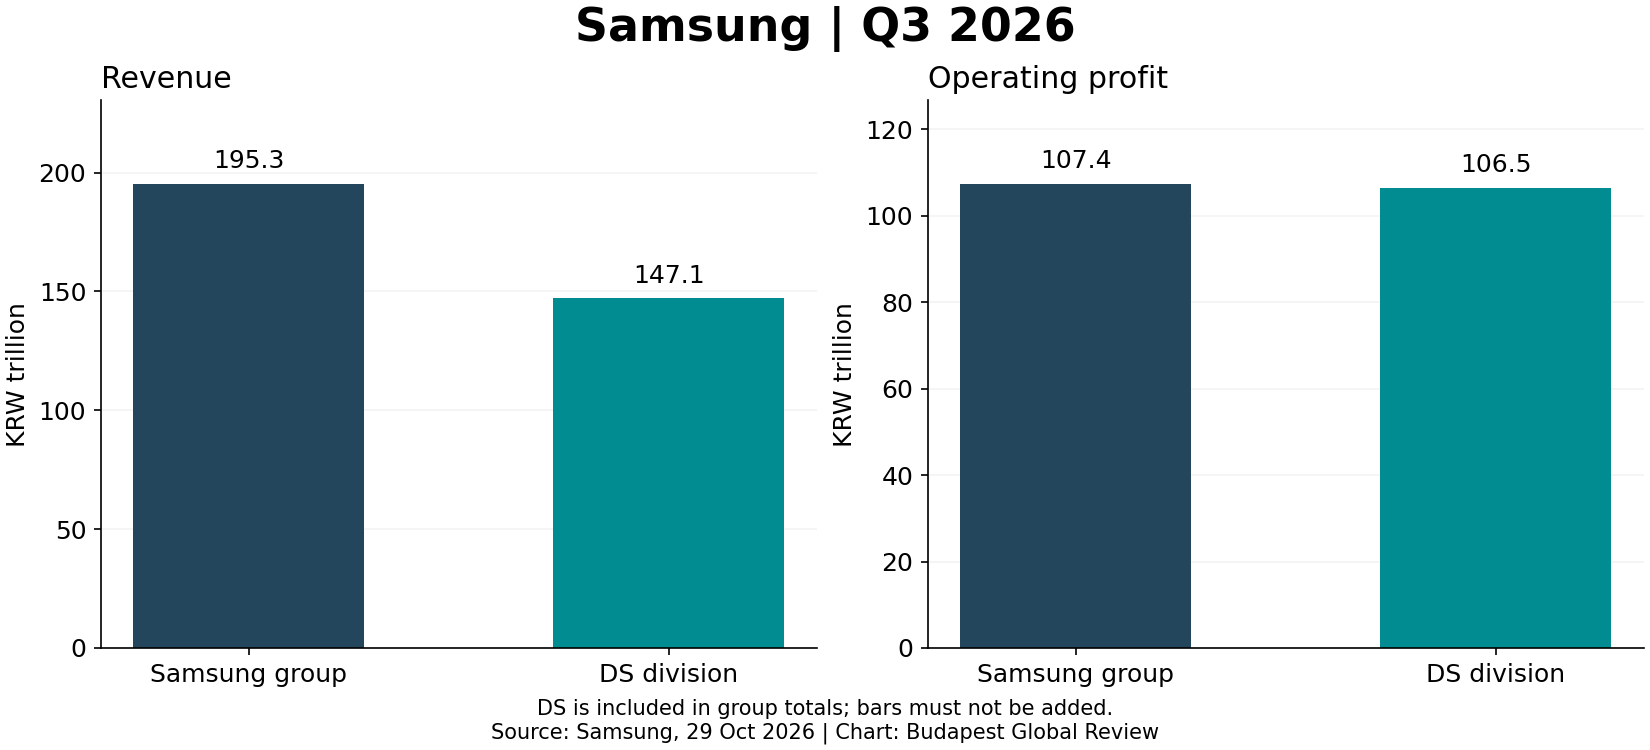
The first chart’s two panels show revenue and operating profit in the same monetary unit, with axes starting at zero. The dark bar represents the entire group and turquoise represents DS. Source: Samsung, 29 October; original chart: Budapest Global Review. Because the panels have different scales, compare the value labels rather than bar heights measured across the separate panels.
The difference between the outstanding division and the entire company is a complex balance. Profits and losses in other businesses, along with consolidation items, can shape it jointly. We therefore do not identify a single consumer product as a source of losses from the difference between the reported group and division figures. That requires separate segment reporting and reconciliation.
Our calculation: margins and concentration
We divide operating profit by the corresponding revenue and multiply by one hundred. This gives an operating margin of 54.99% for the group and 72.40% for DS. The rounded difference is 17.41 percentage points. We rounded to two decimals only after division; the inputs are already rounded figures in the announcement, so the ratios cannot be treated as accounting figures of greater precision.
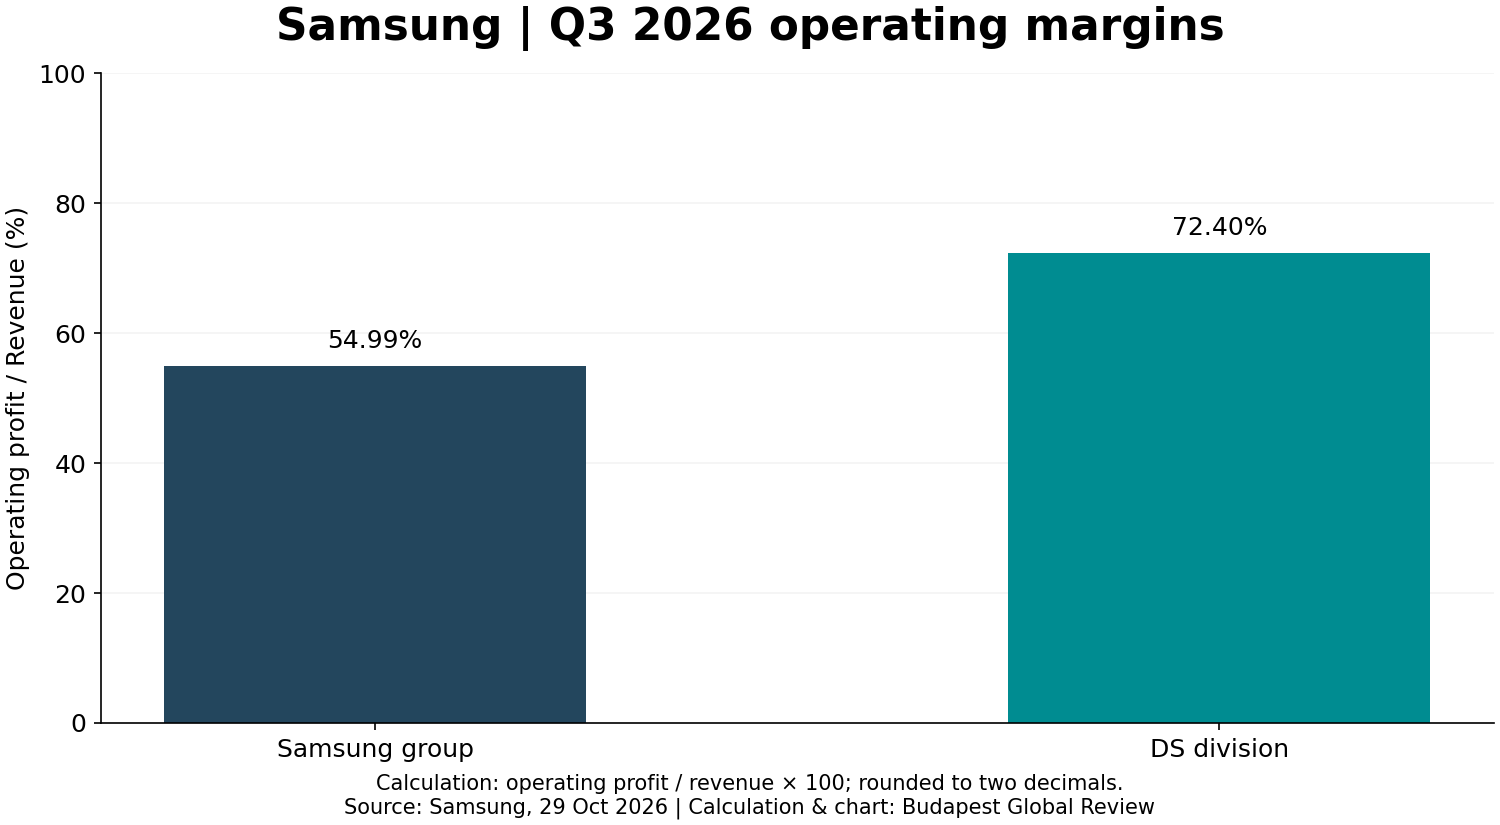
The second chart shows operating profit divided by revenue as a percentage. The dark bar is the group and turquoise is DS. Source data: Samsung; calculation and chart: Budapest Global Review. A common scale gives comparable ratios, but differences in activity and internal accounting mean it is not a general efficiency ranking.
Profit concentration is a separate question: measuring DS operating profit against group operating profit gives 99.16%. This is a division’s share, not a shareholder ownership percentage or a revenue breakdown. The very high figure indicates that interpreting aggregate operating performance for this quarter is particularly sensitive to the semiconductor business. It does not follow that every other division is separately loss-making.
A separate test illustrates sensitivity. If DS operating profit hypothetically fell by 10% while all other profit items remained unchanged, group operating profit would be lower by 10.65 trillion won. The hypothetical new amount would be 96.75 trillion won. This is expressly an illustrative model, not a forecast: the division’s revenue, costs, internal pricing and other divisions’ performance may change together in reality. The test only shows the main earnings-generating division’s mathematical weight in the current base. Removing the assumption that other items remain constant would require a new calculation; the result shown must therefore not be quoted as expected profit for the next quarter.
Our own conclusion concerns the order of analysis. First understand the durability of the main earnings-generating activity, then the ability of other areas to provide a counterbalance. A favourable product mix and temporarily tight supply can produce similar quarterly profit profiles while implying different longer-term risks. Their exact weights cannot be separated from the present data.
Yesterday’s SK hynix analysis examined the divergence between operating profit and net income. For Corning’s figures, the distinction between reported and adjusted measures mattered. At Samsung, the current question is concentration between the company and its division; we do not place different accounting concepts into a common return ranking.
Outlook, forints and costs
A favourable scenario would be sustained demand while new capacity comes on stream in a disciplined way. In an adverse scenario, customers’ investment pace could slow and supply growth could put pressure on prices. These are conditional analytical paths, not verified order books or probability forecasts. The high reported operating margin guarantees neither continuation.
Another investor risk is the entry price. Shares in an operationally strong company can still produce losses if the market price assumes an overly favourable future. Without a verified share price and a complete valuation model, this article offers no price target or buy rating. Nor do we derive a dividend directly from operating profit, because investment, financing and cash-flow decisions need separate examination.
Our own purely illustrative currency model starts with 1000000 forints. Assume a 6% share-price gain in won, a 5% decrease in the won’s forint value and total costs of 0.8% applied to the closing value. The factors are 1.06 × 0.95 × 0.992; the result is 998944 forints. With a currency movement of the same size in the opposite direction, the factors are 1.06 × 1.05 × 0.992 and the closing value is 1104096 forints. We have thus defined the direction using the won’s value expressed in forints, not an inverse exchange-rate quotation.
This is a hypothetical calculation, not a current exchange rate or provider fee quote. It excludes tax, dividends and interest, treating costs as one aggregate deduction. The actual investment instrument may introduce a different currency, custody charges, conversion costs or tracking differences. These need to be fitted to the model using the particular product’s documents, rather than estimated from the company’s quarterly earnings.
In the next report, segment reconciliation, cash flow and investment developments may help determine how durable concentrated profits are. For a Hungarian saver, this becomes useful when interpreted alongside the selected instrument’s terms and their own currency exposure. This article provides general analysis without personalised advice to buy or sell.
Original editorial content. Read our editorial standards.
Budapest Global Review: Samsung: profits concentrate in the semiconductor business. Budapest Global Review, 29 October 2026. https://globalreview.hu/en/cikk/samsung-eredmeny-koncentracio-devizakockazat-2026