
Corning’s quarterly figures released on 27 October show different revenue and income under its reported and company-adjusted presentations. Hungarian equity investors should examine this difference separately from USD exposure and trading costs: interpreting the company’s performance and calculating the investment’s proceeds after conversion require different calculations.
The company release for the period ended 30 September reports revenue of USD 4855 million and net income attributable to Corning of USD 680 million on a GAAP basis. The company’s core measures give revenue of USD 5081 million and income of USD 795 million. Chief executive Wendell P. Weeks said, “We delivered an outstanding third quarter.” That is management’s assessment; our calculation below examines the difference between the two reporting frameworks.
In brief
- Revenue and income adjustments differ proportionately, so the ratio calculated from them changes too.
- Our original charts compare the same quarter, distinguishing company data from a calculated measure.
- We separate Hungarian investors’ currency and cost effects from the company accounts using a hypothetical example.
Two presentations, different ratios
The upper panel of the first chart shows revenue and the lower panel income, in USD million. Both axes start at zero, but the panels have different scales: the height of a revenue bar should therefore be compared only with the other revenue bar. Colours identify the same reporting framework in each panel. The chart is neither a share-price series, an annual growth rate nor a cash-flow statement.
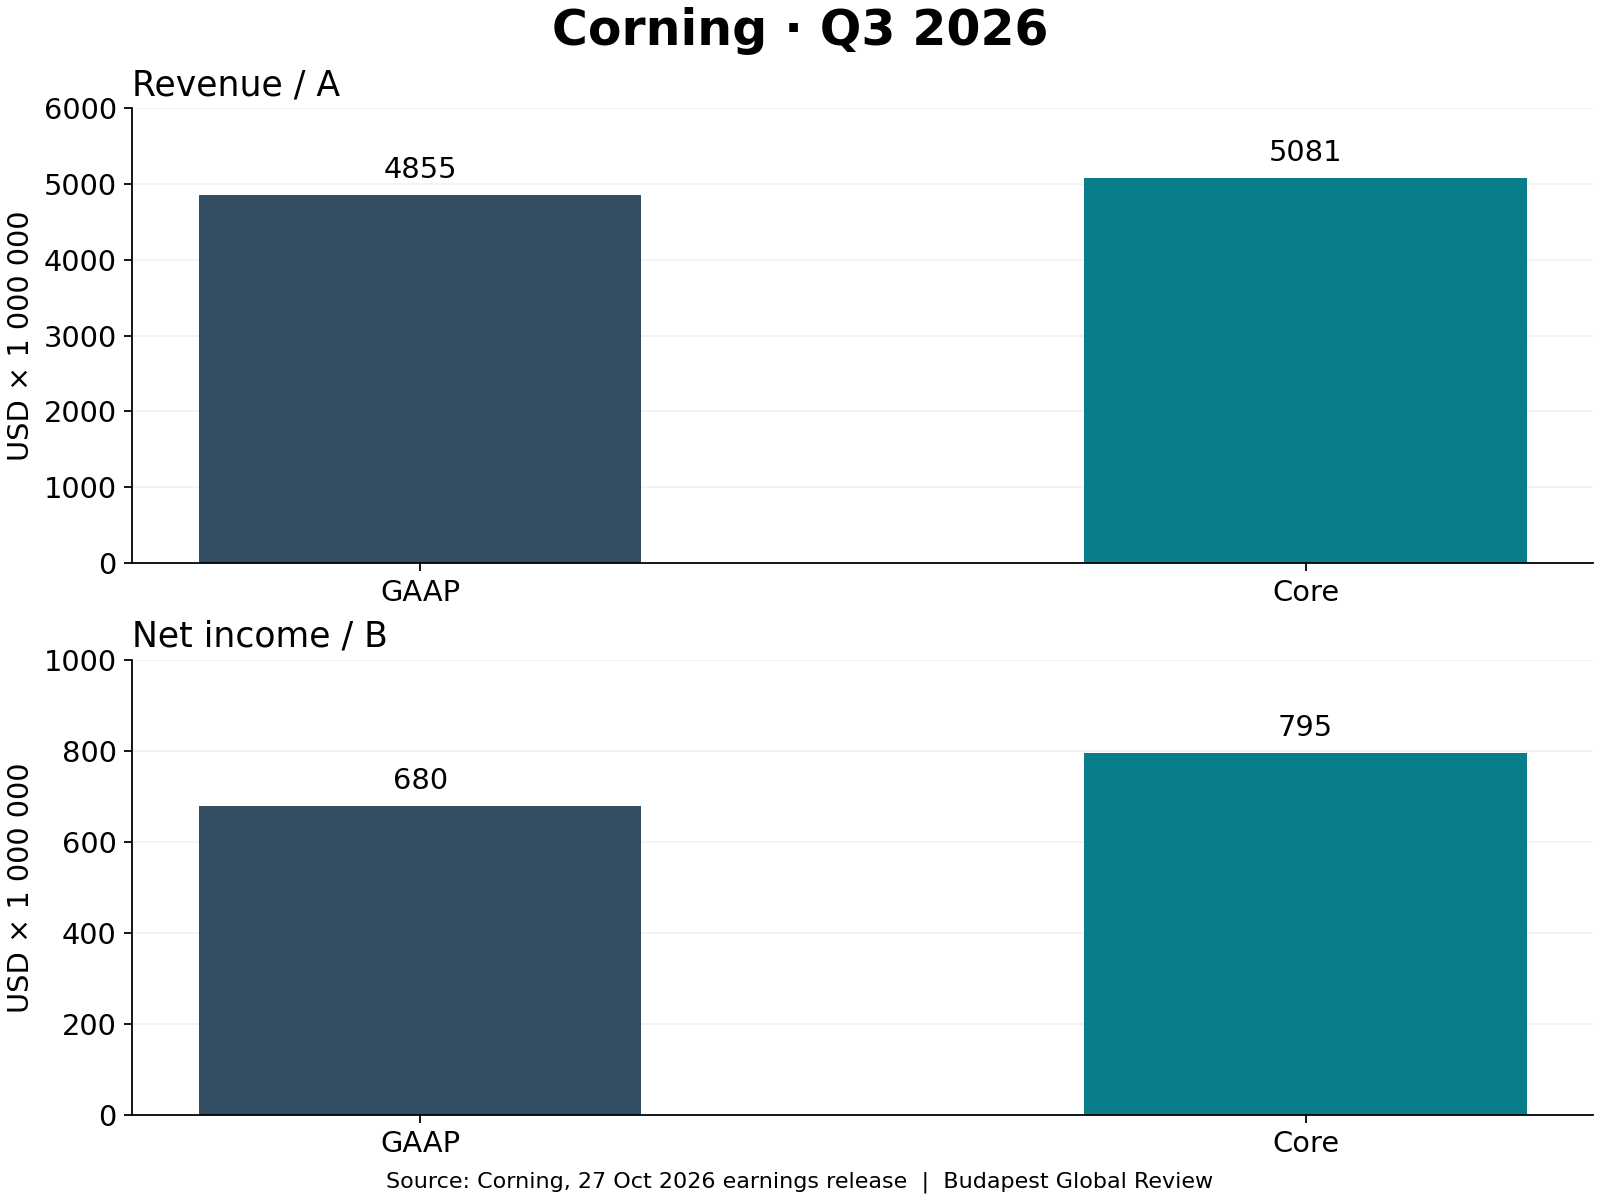
Our calculation gives a revenue difference of 5081−4855=226 million USD. The income difference is 795−680=115 million USD. Relative to the reported bases, these are 4.65% and 16.91%, respectively. The larger income difference explains why the adjusted income ratio changes more than the revenue difference alone might suggest. This is a mathematical observation; the economic justification for the adjustments requires separate assessment.
For the second chart, we divided income within each framework by revenue within that same framework. The GAAP ratio is calculated as 680/4855×100, giving 14.01%. The core ratio is 795/5081×100, giving 15.65%. Calculated before rounding, the difference is 1.64 percentage points. We call this original measure a net-income ratio; it does not measure the company’s operating margin or free cash flow.
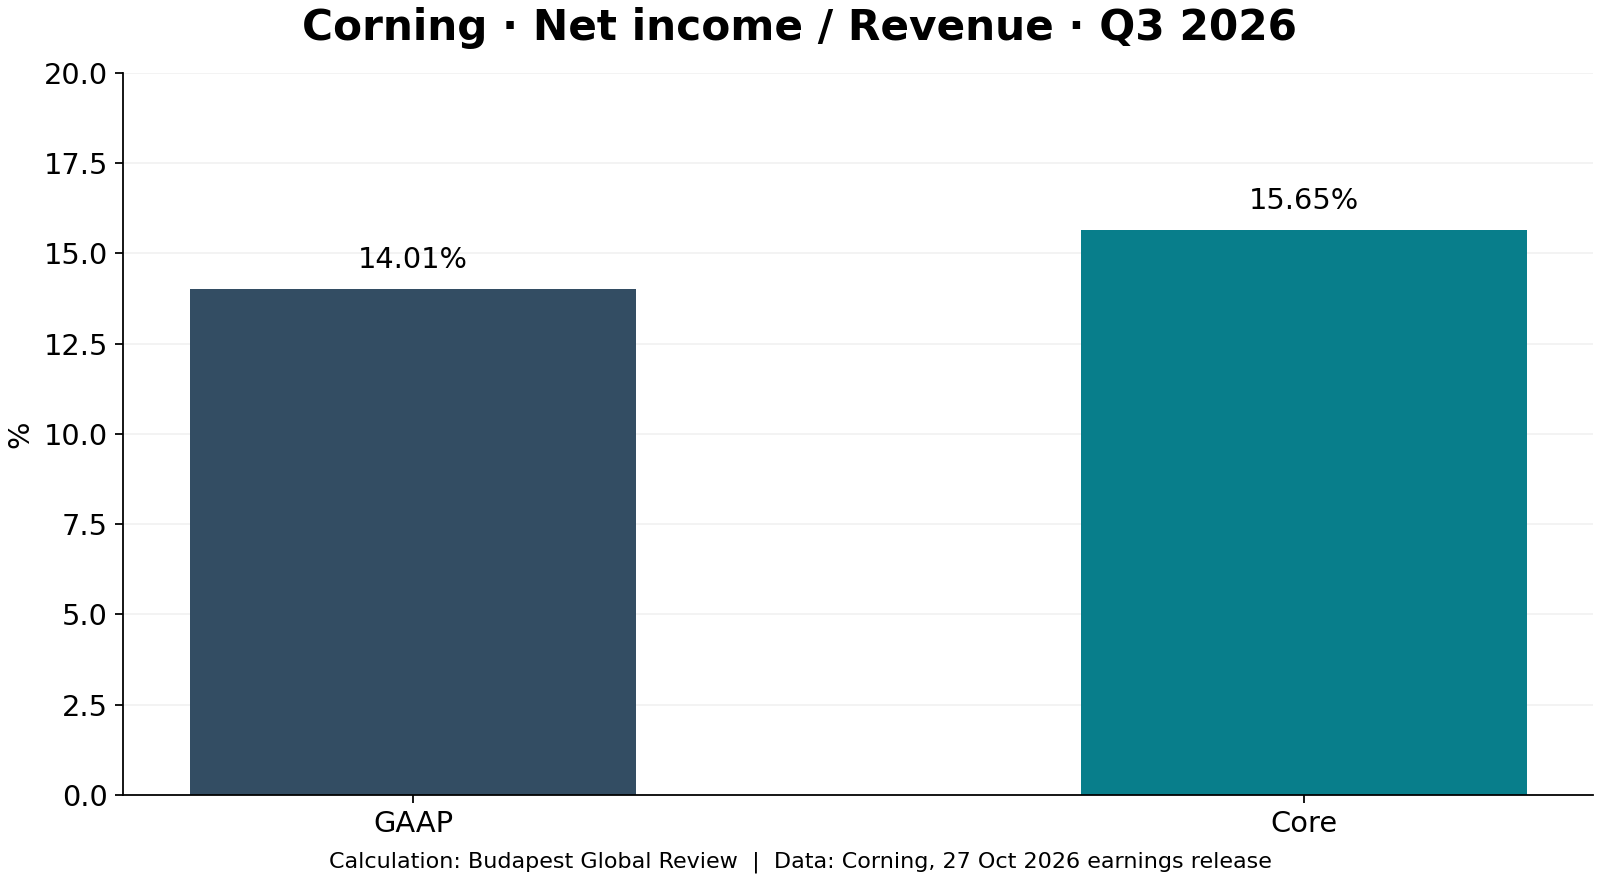
The company presents core figures as alternative performance measures. Analysis requires examining which items are excluded from reported income, how often they recur and how they relate to actual cash movements. A regularly recurring exclusion can persistently affect shareholders’ economic position even when management removes it to describe operations. We therefore do not automatically select the more favourable of the two bars.
Method and uncertainty
The calculation uses only the release’s revenue and income lines for the same period. We used the original values expressed in millions and rounded percentages to two decimal places only at the end. The charts are our own work. For the percentage-point difference, we first subtracted the full-precision ratios, preventing rounding of the displayed values from accumulating as a hidden error.
This is a cross-sectional comparison and does not demonstrate a trend over time. A higher ratio cannot establish next quarter’s profitability, the durability of orders or the stock’s valuation. Those require further periods, an itemised reconciliation of adjustments, capital expenditure and cash flow considered together. The company release is a primary data source but explains the position of an interested party: management’s description is not independent analytical confirmation.
Our Safran revenue comparison illustrates the importance of separating different measures in another corporate setting. Our Verizon revenue breakdown shows how components moving in opposite directions can sit behind a total. These are methodological connections; the companies’ different business structures prevent us from treating their measures as interchangeable.
Reproducibility also requires the reader to see how the denominator was chosen. Dividing adjusted income by reported revenue would create a mixed measure for which this comparison provides no justification. Treating net income as cash would be another error: accounting recognition and investment payments can occur at different times. The balance sheet, debt and future obligations provide further context when assessing a share’s value. Without those, these charts serve a narrow purpose: they show how much difference the reporting framework makes to the selected data, leaving sustainability and valuation unresolved. This is a deliberately limited analytical framework.
Risks to examine include fluctuations in demand, customer concentration, returns on capacity expansion and the conversion of earnings into cash. These are factors for investigation, not claims that any has now deteriorated. In a favourable scenario, strong cash generation supports operating performance; in an adverse scenario, financing or capital-expenditure requirements rise alongside reported improvement. None of the four disclosed figures proves either path.
Measuring the investment in forints
Investor.gov’s guidance discusses currency effects and costs as separate risks of international investing. Our example examines a Hungarian investor’s starting capital of HUF 1000000. Assume the share rises 10% in USD while the USD’s forint value falls 10%. The product of the two changes is 1.10×0.90=0.99, giving a return before costs of −1%.
If the assumed total transaction cost equals 1% of the closing value, the model gives 1000000×1.10×0.90×0.99=980100 HUF. The USD return required to offset both currency depreciation and the cost is calculated as 1/(0.90×0.99)−1, or 12.23%. The model supplies neither a current exchange rate, a bank fee nor an expected stock return. It excludes dividends, tax and intermediate cash flows.
Actual charges may depend on the provider, order size, conversion method and account. With a fixed minimum charge, the percentage burden may be larger on a smaller investment, so the example’s rate cannot be generalised to every transaction. A weakening forint would change the domestic-currency outcome in the opposite direction while leaving the company’s reported quarterly figures unchanged.
At the next company earnings release, the reconciliation between reported and core figures, cash flow and capital-expenditure requirements should be examined together. We give no date without a verified calendar announcement. A narrowing difference may improve transparency; a widening difference may require more detailed explanation. Neither is a mechanical buy or sell signal.
Original editorial content. Read our editorial standards.
Budapest Global Review: Corning: adjusted figures produce a higher income ratio. Budapest Global Review, 27 October 2026. https://globalreview.hu/en/cikk/corning-korrigalt-eredmenyarany-negyedev-2026