
Safran’s release of 23 October reports different revenue totals on adjusted and consolidated bases. Hungarian retail investors first need to clarify the measure’s definition and then their own exposure in forints: company sales and the outcome from owning a share require separate calculations.
This analysis makes its own comparison from the reported figures, then separates share-price, currency and cost effects through a hypothetical investment. The examples are educational scenarios, not price forecasts or recommendations for a personalised transaction.
In brief
- Comparing adjusted and consolidated revenue requires consistent use of the same denominator.
- The result in forints is shaped jointly by the share’s performance in euros and the exchange rate.
- Fees, taxation and the actual execution price require separate examination.
Two revenue lines and a consistent comparison
In Safran’s release, third-quarter adjusted revenue is 9003 million euros and consolidated revenue is 8890 million euros. The corresponding first-nine-month figures are 26574 million euros and 26135 million euros. CEO Olivier Andriès referred to “healthy demand”. This is management’s assessment; the calculations below are our own.
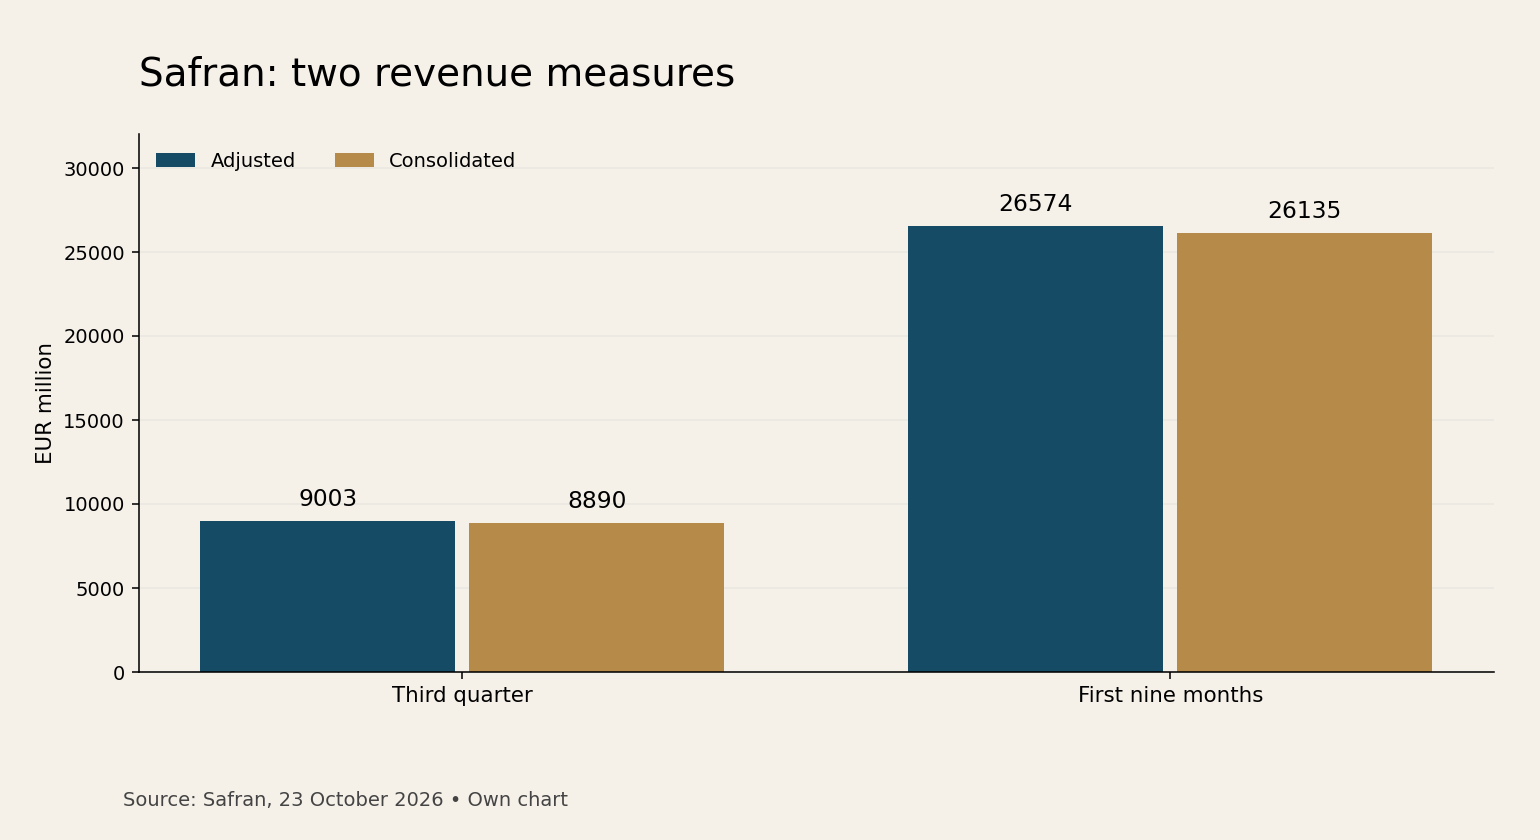
The chart uses the company’s October release, with amounts in millions of euros. Our chart places the measures alongside each other within the same period. The longer period’s higher total does not indicate acceleration: it contains more months of activity. Direct comparison between bars is therefore meaningful within a single period.
Our calculation puts the quarterly difference at 113 million euros, or 1.27% of the consolidated total. The nine-month difference is 439 million euros, or 1.68% with the same denominator choice. In both cases the formula is adjusted revenue minus consolidated revenue, divided by consolidated revenue, multiplied by one hundred. Percentages are rounded to two decimal places.
These differences measure the distance between reported metrics, not lost money or additional profit. Without cost information, the revenue lines cannot establish an operating margin either. Separate information is also needed to determine how much invoiced activity has been received in cash. Revenue, earnings and cash flow therefore deserve separate fields in a valuation model.
The practical lesson is comparability. Using adjusted numbers for one period and consolidated numbers for another would mix changes in performance with changes in measurement basis. Each input should carry a period, unit and definition. Further explanation of differences requires the company’s reconciliation statement; missing lines should not be replaced with guesswork.
A hypothetical investment measured in forints
The US securities regulator’s international investing guide discusses exchange-rate movements as a general risk. We use only this financial relationship here, without applying US tax or account rules to Hungarian investors. In the example, the forint price of the euro changes from its starting value while the share price in euros stays constant.
Our hypothetical starting capital is 1000000 forints. We examine three cases: the forint price of the euro falls by 5%, stays unchanged or rises by 5%. Before fees, ending values are 950000, 1000000 and 1050000 forints respectively. These are calculated examples, not observed market prices; we assign neither probabilities nor time-specific expectations to them.
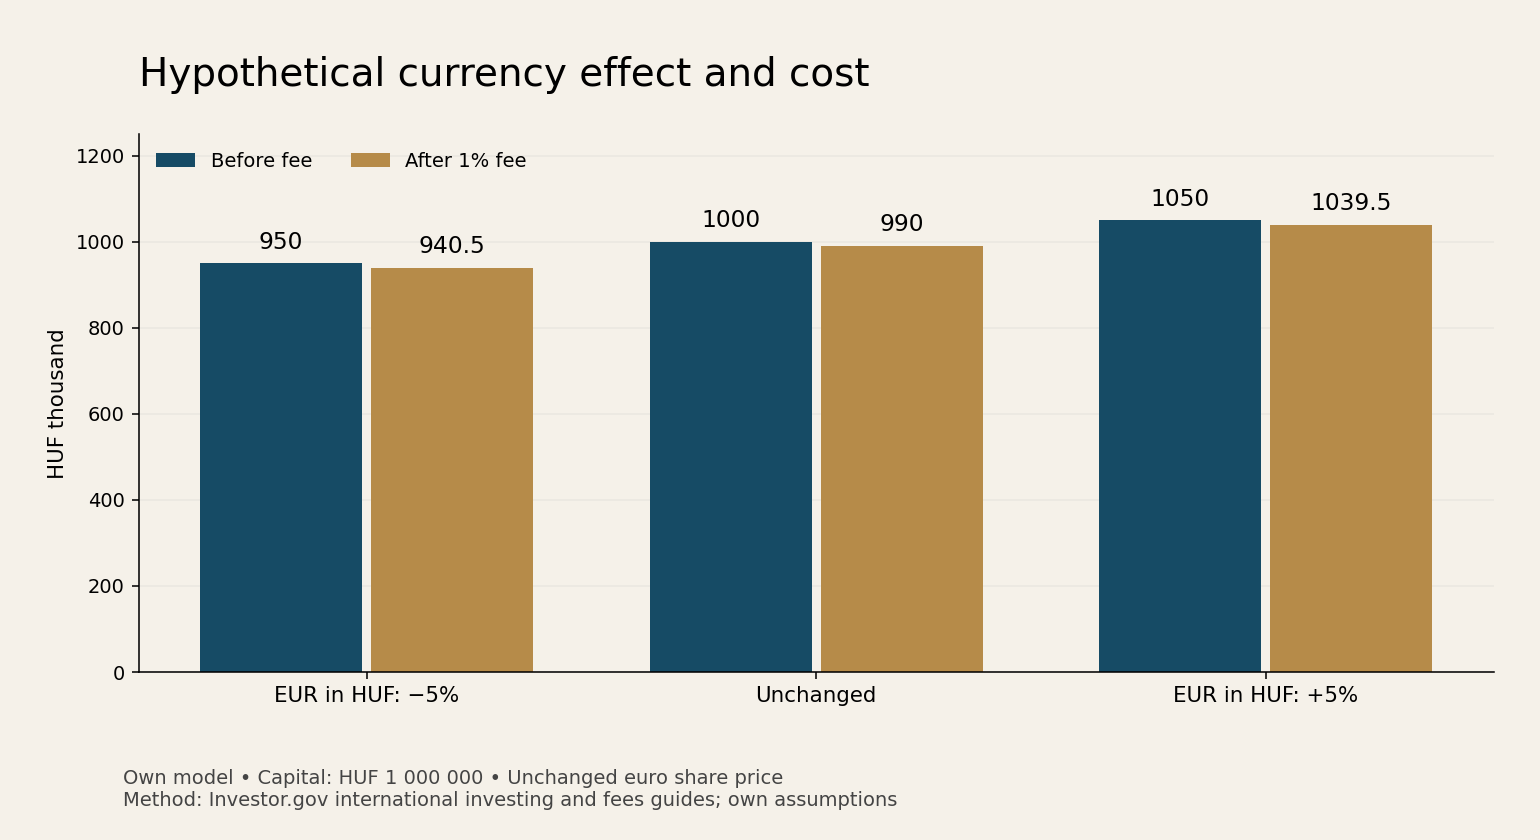
The second chart is our own model. The previous source supplies the conceptual currency background, while the regulator’s fees guide explains costs. We assume that 1% of the entire portfolio is deducted at the end as a single combined cost. Remaining values are 940500, 990000 and 1039500 forints. The model is not an actual provider’s fee quotation.
The reproducible formula multiplies starting capital by the share-price change factor, then by the change factor in the euro’s forint price, then by the fraction remaining after the cost deduction. The share-price factor is unity in this example. Different share performance can be inserted using the same logic, but the resulting value remains a consequence of the chosen assumptions.
We deliberately combine fees into one final deduction to keep the currency effect clear. On a real account, purchase commission, sale commission, exchange spreads and any account charges can arise at different times. Replacing itemised charges with this simple example would therefore give an inaccurate personal return estimate. We model neither tax nor dividends; these need separate assumptions.
Outlook and the next examination
Our conclusion is that revenue figures offer a reference point for company scale, while share valuation requires additional information. Sustained demand could be a favourable scenario if delivery and cash collection follow it. In a weaker case, costs, delivery difficulties or payment timing could reduce the earnings retained from revenue. These are conditional risk channels, not claims of new company events.
Distinguishing corporate currency exposure from personal currency exposure is particularly useful for Hungarian readers. Converting a euro-denominated share into forints affects the investor; the company’s own sales and cost currencies constitute another analytical level. Applying the same percentage to both would be unjustified. Precise corporate risk analysis also requires actual exposures and hedge terms.
Our earlier Lam Research analysis examines revenue and margins, while our SLB article adds a profitability perspective. In Safran’s next detailed report, continuity of metric definitions, conversion of revenue into earnings and cash generation should be examined together. The decision-relevant question will be which assumptions the new evidence supports or challenges.
The company’s financial calendar lists an IFRS18 workshop on 3 December and full-year results on 9 February 2027. The events serve different purposes: the former may help explain the reporting framework, the latter annual performance. We treat the announced dates as scheduled events, not results already released.
For independent assessment in the meantime, a worksheet recording the source and date beside every input can help. A subsequent correction remains traceable and the earlier conclusion can be recalculated. Calculation accuracy, however, extends only as far as input accuracy: a wrong period or different currency can make flawless multiplication misleading. With the next report, data alignment should therefore precede interpretation of changes. The present comparison is a starting point and does not replace a complete examination of the share’s risks or valuation.
We have therefore visibly separated all assumptions from the numerical facts actually reported by the company.
Original editorial content. Read our editorial standards.
Budapest Global Review: Safran: different revenue measures and separate forint risk. Budapest Global Review, 23 October 2026. https://globalreview.hu/en/cikk/safran-beveteli-merleg-devizakockazat-2026