
Verizon’s quarterly report released on 26 October shows that growth in service and other revenue offset a decline in equipment revenue. For Hungarian retail investors, currency conversion and trading costs shape the investment outcome alongside the composition of revenue.
In brief
- We compare revenue lines using the same period and unit of measurement.
- Our calculation shows how much the two components added and subtracted.
- A separate hypothetical model illustrates the risk faced by an investor measuring returns in forints.
Two directions behind revenue
The unaudited financial table compares the three months ending 30 September 2026 with those ending 30 September 2025. Amounts are in million USD. Service and other revenue moved from 28202 to 29197, wireless equipment revenue from 5619 to 5116, and total revenue from 33821 to 34313.
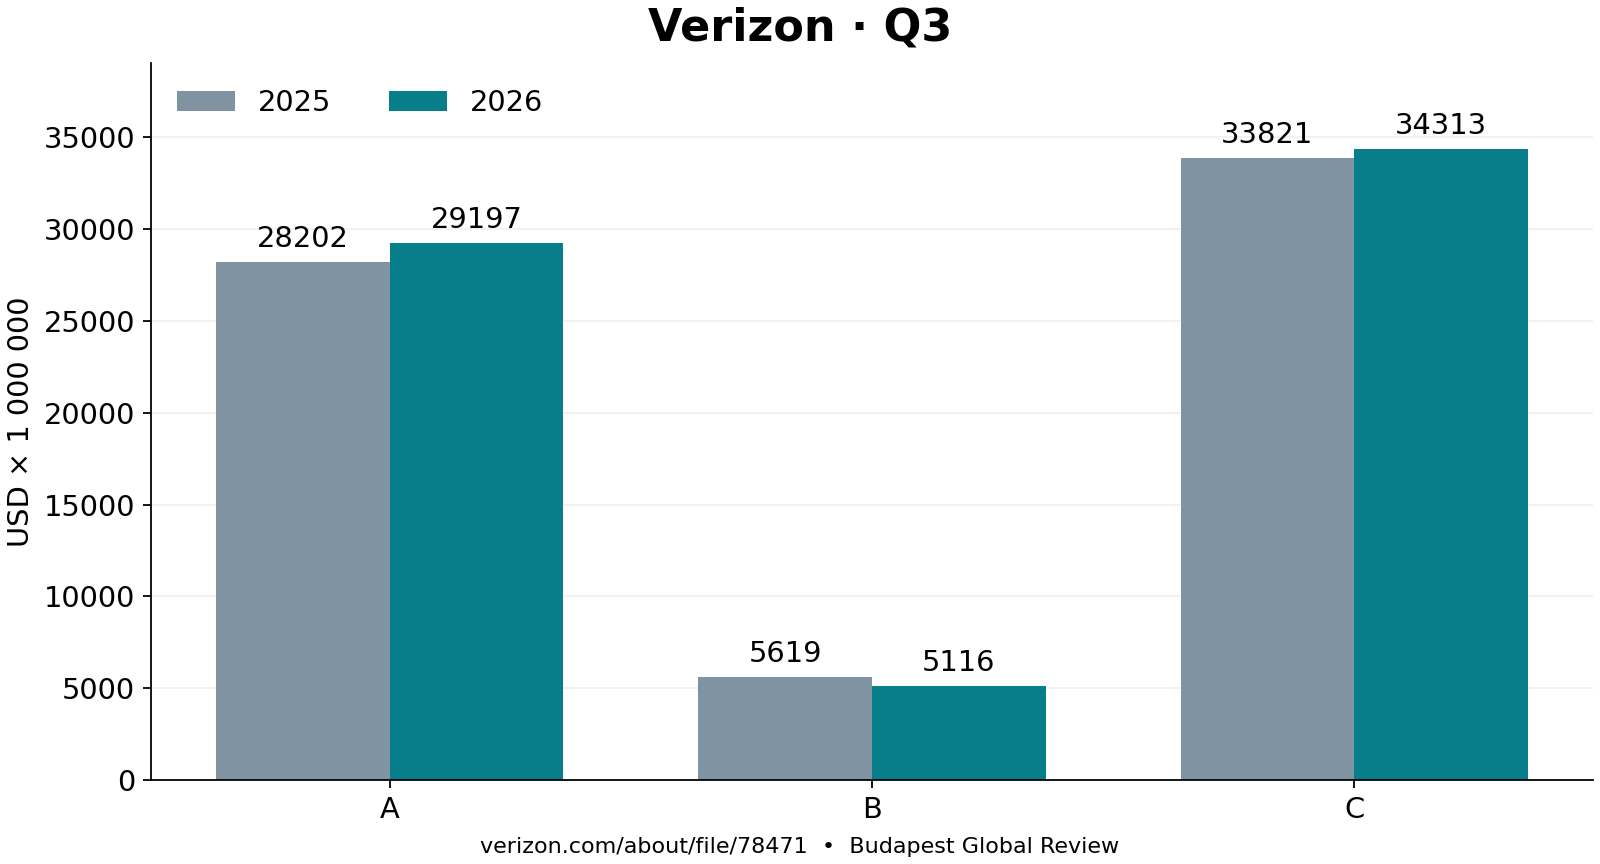
The first chart is our own presentation, sourced from the linked financial table. Bars share a zero baseline, allowing direct comparison of their size. Key: A service and other; B equipment; C total revenue, summing the components. Categories follow the company’s financial statement terminology; we do not restrict the service and other line to mobile subscriptions alone.
“Verizon delivered another record-breaking quarter,” said CEO Dan Schulman in the company release. This is management’s assessment. Our analysis is confined to the reported revenue lines, and does not extend the record claim to every financial measure or to the share price.
Different directions of change therefore lie behind the increase in aggregate revenue. It does not follow that every business activity strengthened. Moreover, revenue by category is not segment earnings: the revenue chart does not show how much profit each activity generated. Assessing profitability would also require a separate examination of associated costs, capital investment and financing expenses.
Our calculation and methodology
The service and other line changed by 995, the equipment line by minus 503, and the total by 492 million USD. The calculation is subtraction: the corresponding prior-year figure is deducted from the new value. The sum of the two component changes equals the difference in total revenue, so the breakdown is complete at this level.
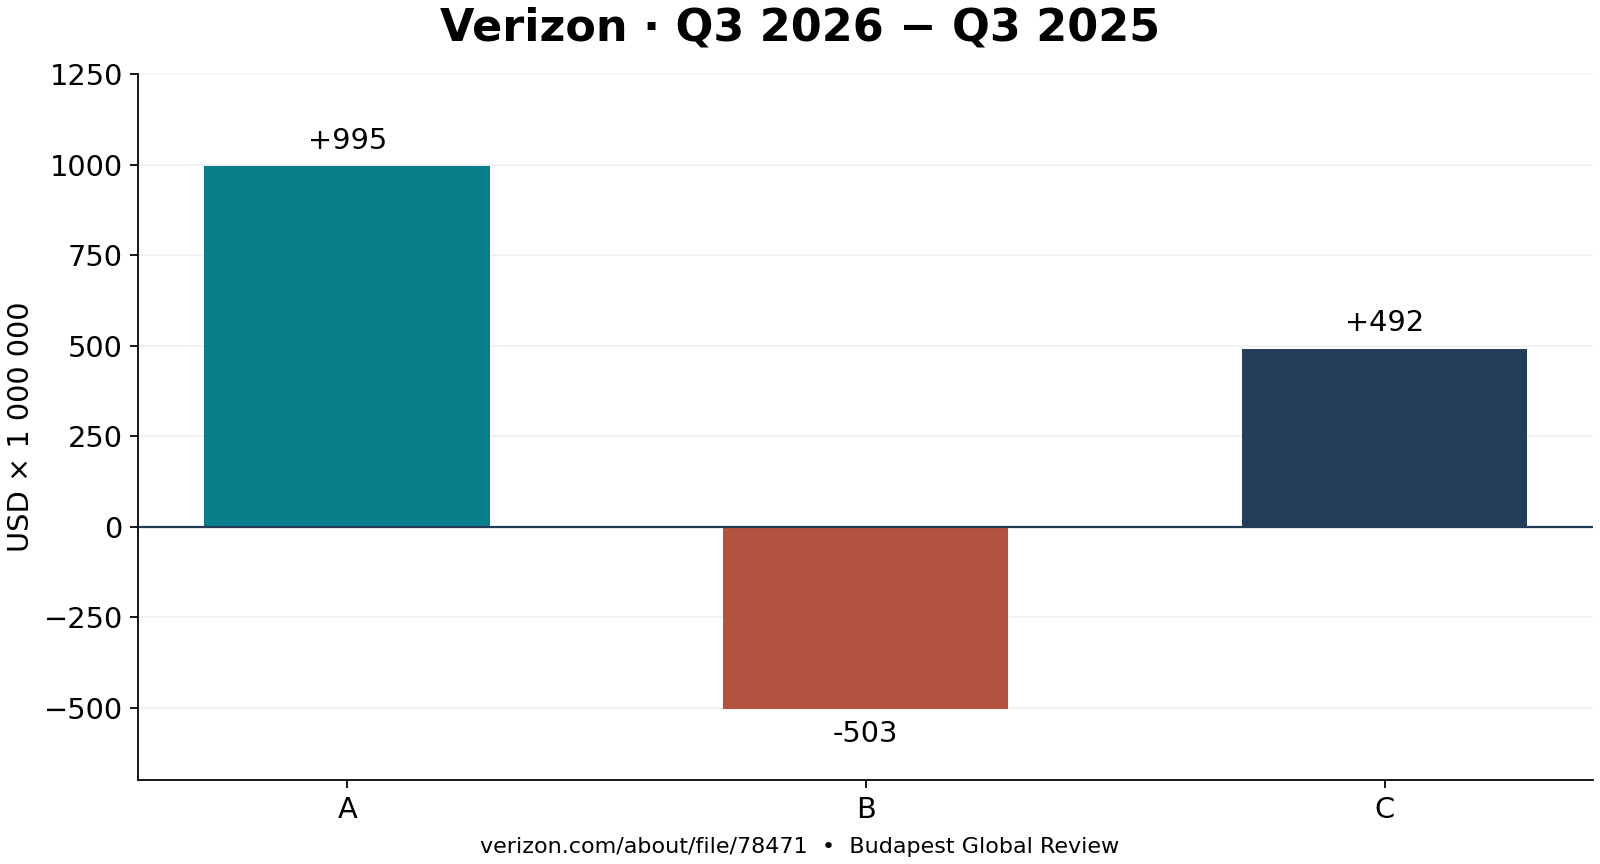
The second original chart uses the same data: a positive bar shows expansion, a negative bar decline, and a separate bar the balance. This bridges the previous and current quarterly revenue figures; it is not a share-price forecast. The overall year-on-year change is calculated by dividing new total revenue by the old total and subtracting one; expressed as a percentage rounded to two decimal places, the result is 1.45%.
The magnitude of the equipment decline offset 50.55% of the increase in the other line. Here, the absolute value of the decline is divided by the positive increase. The choice of denominator matters: this is the relationship between changes, not revenue market share or a company-wide loss ratio. Rounding was performed only at the end, with the input data left unchanged.
Readers can repeat the operations in a spreadsheet: separate columns can hold the base and current periods, followed by the difference and a check of the sum. If a line is subsequently revised, every measure calculated from it must be recomputed. Data from another quarter or in a different currency cannot be silently inserted into this series. Reproducibility helps identify exactly this kind of mixing.
Our conclusion is that the components together determine the character of the current revenue expansion. In a favourable scenario, service growth persists while the equipment decline moderates. In an adverse scenario, the positive component slows while the negative component continues to drag down the total. These are conditional directions; we assign neither probabilities nor future revenue values to them.
Forint risk, costs and the next step
The Investor.gov guide to international investing explains in general terms that exchange-rate movements can increase or reduce investment returns. From a Hungarian perspective, company performance, the share’s return in its own currency and the effect of converting to forints are therefore separate questions. The initial purchase price also stands between a good report and a profitable investment.
In our illustrative model, starting capital is 1000000 HUF, the share’s value in its own currency is unchanged, and total costs are 1% of the final gross value. If the USD’s forint value rises 5%, the after-cost amount is 1039500 HUF; if it falls 5%, it is 940500 HUF. In both cases the model multiplies starting capital by the currency-change factor and then by the factor remaining after costs.
These calculations use invented assumptions; they are not current currency quotations, fee offers or promises of returns. They exclude tax and dividends. Actual costs can depend on the provider, transaction size, account and conversion method, so the rate in the example cannot replace a specific fee schedule. A fixed monetary fee can impose a proportionally different burden on a smaller investment.
Our analyses of SLB’s earnings ratio and Safran’s different revenue measures apply similar methodological discipline to different companies. Across sectors, revenue structure, capital intensity and metric definitions can differ, making a simple growth ranking misleading.
To examine uncertainty, readers can keep observed data and assumptions in separate columns. Observations should carry a source and period, while assumptions should carry their rationale and sensitivity. This preserves visibility over whether a change of opinion arose from a new fact, a changed assumption or a calculation correction. The three cases may justify different editorial and investor conclusions.
A limitation of this analysis is that the selected revenue breakdown does not explain every customer decision. Changes in price, quantity sold and product mix can produce similar aggregate movements. We do not estimate their weights from the table presented. Nor does co-movement between service and equipment revenue establish a causal relationship between them.
The practical reading order is therefore to check the period, unit, revenue category and calculation. Only then should the conditional business scenario and the reader’s own cost situation be considered.
The next substantive company release will be worth examining for whether the current relationship between the two revenue lines persists, and how associated costs develop. Any stock-market reaction requires separate assessment using timestamped market data. This analysis provides no buy or sell signal, price target or personalised investment advice.
Original editorial content. Read our editorial standards.
Budapest Global Review: Verizon: diverging revenue trends and separate forint risk. Budapest Global Review, 26 October 2026. https://globalreview.hu/en/cikk/verizon-beveteli-osszetevok-forintkockazat-2026