
SK hynix’s earnings release of 28 October shows both rising operating profit and declining net income compared with the previous quarter. Hungarian retail investors therefore need to examine the definition of profit separately from investment performance translated into forints. Our calculations use two charts to separate the company’s figures, followed by a conditional currency model showing the combined effect of exchange rates and costs.
In brief
- Comparing the second and third quarters gives different directions for operating profit and net income.
- We calculate each income ratio against revenue for the same period, using full-precision inputs.
- Currency movements and transaction costs can also change investment results measured in forints.
Different profit lines
The company’s preliminary consolidated K-IFRS table reports second-quarter revenue of 79.3187, operating profit of 60.5426 and net income of 93.9226 trillion South Korean won. The corresponding third-quarter figures are 104.6155, 83.3338 and 39.7756 trillion won. The company identifies the figures as subject to review. The Korea Times report independently confirms the revenue and operating-profit figures in rounded form.
In the release, CEO Kwak Noh-jung referred to “mid-to-long term demand visibility”. This is management’s assessment. Our methodological conclusion is that the demand outlook and profit recognised in a particular period require separate evidence. A forward-looking company statement does not replace subsequent delivery and does not provide a ready-made stock valuation.
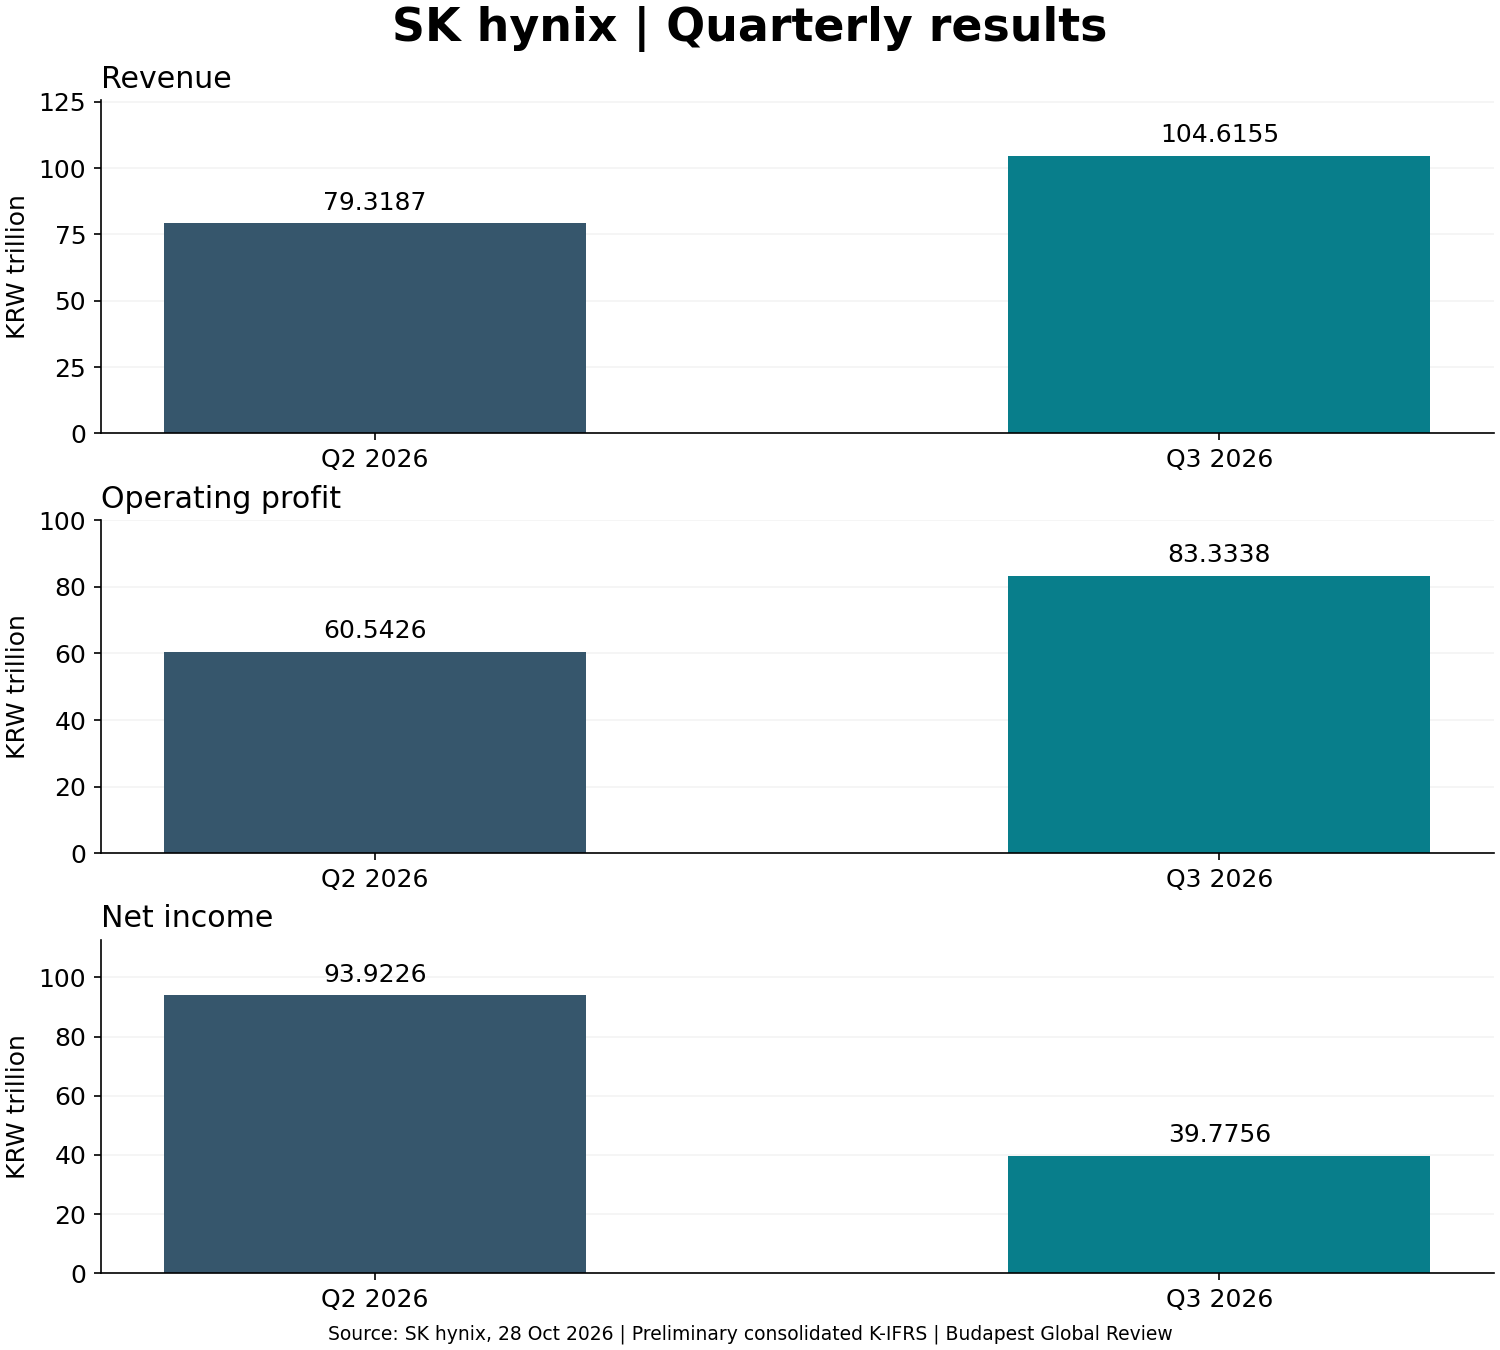
The first chart shows revenue, operating profit and net income in three separate panels, with scales starting at zero. Bars are measured in trillion won; labels preserve the input figures. The source is SK hynix’s earnings release of 28 October, and Budapest Global Review produced the chart. Because the panels are separate, bar heights should only be compared within the same panel.
Our subtraction shows revenue increasing by 25.2968 trillion won and operating profit by 22.7912 trillion won, while net income fell by 54.1470 trillion won. These are quarterly differences, not annual changes. Each calculation subtracts the second-quarter figure from the third-quarter figure, keeping the interpretation of the sign consistent throughout.
Reading the ratios
Our calculation shows operating profit relative to revenue rising from 76.33% to 79.66%. The equivalent net-income ratio fell from 118.41% to 38.02%. Both are percentage measures, but they use different profit lines. The first divides a line closer to operations by revenue; the second divides total net income by revenue.
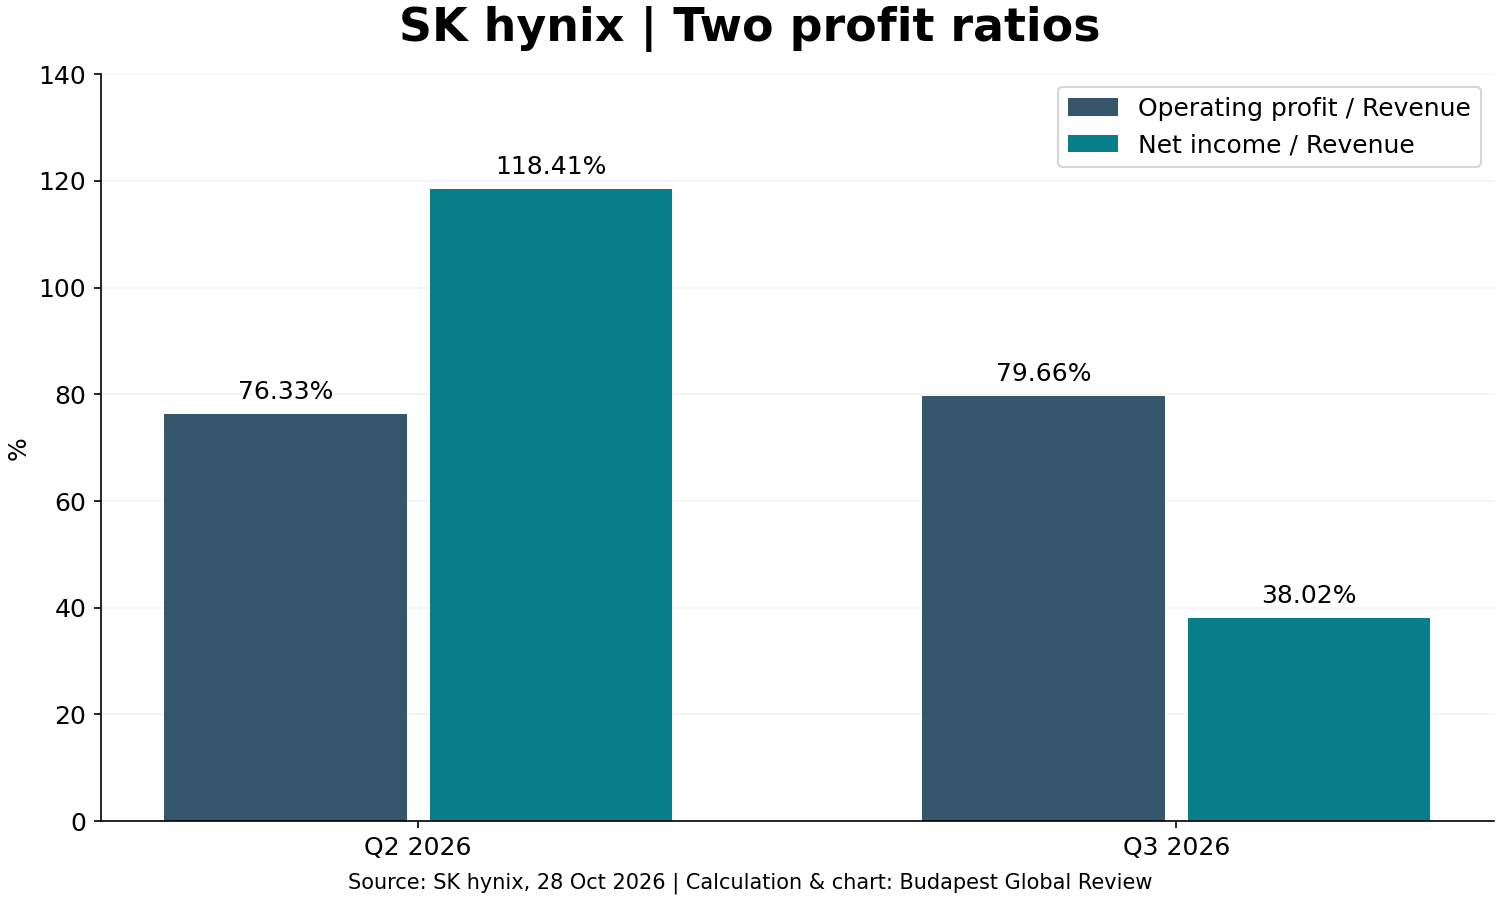
The second chart applies the formula profit divided by revenue, multiplied by one hundred. Rounding occurs only after division, to two decimal places. Its source is the same company table; the calculation and chart are our own work. The earlier net-income ratio exceeding one hundred per cent signals that profit need not move exclusively with revenue from sales.
The differences can be calculated from the table, but the weight of individual causes requires further reconciliation. Without the detailed income statement, we do not allocate the changes to taxation, financing, investment gains or other items. This requires a bridge tracing the statement from operating profit to net income. That bridge should be checked in the reviewed financial statements.
A useful worksheet for Hungarian readers therefore keeps revenue, operating profit, net income and operating cash flow in separate columns. We do not quantify the last of these without verified inputs. Capital expenditure requirements, working capital and financing can all affect the relationship between a profitable period and cash available for shareholders.
Our Corning reporting comparison examined a different accounting question, while the Verizon revenue analysis examined components moving in different directions. The shared methodological lesson is to select comparable lines. Ratios from different companies do not automatically form a ranking, because business models, capital intensity and reporting scope can differ.
A scenario measured in forints
The following model is purely hypothetical: initial capital of 1,000,000 forints, a local share return of 8%, a 6% depreciation of the investment currency against the forint, and an aggregate cost of 1% deducted from the final value. These are not current won exchange rates, share prices or a provider’s fee quotation. The model excludes taxation and dividends, which would require separate inputs.
The reproducible multiplication is 1,000,000 × 1.08 × 0.94 × 0.99 = 1,005,048 forints. This leaves a forint return of 0.5048% from the local share-price gain. In the model, the currency effect applies to the entire local final value, and costs apply to the resulting amount. Simply adding percentages would give a different result, so we state the multiplication sequence and the applicable bases.
This calculation illustrates risk rather than forecasting probabilities. A more favourable currency path would raise the forint value, while a less favourable one would reduce it. Different purchase and sale fees, currency-conversion spreads or recurring account costs require a more detailed model. Without the investment’s specific trading venue and settlement currency, we do not claim an available Hungarian retail cost level.
An investor’s own checking table should retain the release date and calculation formula alongside the original data. Later changes can then distinguish inputs revised by the company from rounding applied by the editor. A chart label must not imply greater accuracy than its underlying data supports. If the company restates an earlier period, the comparison must also be rerun and the change visibly identified. The earlier conclusion then requires review even if the main direction in the headline remains unchanged. This makes the analysis verifiable later.
We interpret the company outlook conditionally. If operating performance remains strong while other items influencing net income normalise, the two profit lines could move closer together. In another scenario, investment and changing demand weigh simultaneously on profit and cash. These are analytical possibilities, not the company’s quantitative forecasts.
Next we will watch the reviewed financial statements, the bridge between operating profit and net income, and capital expenditure and cash-flow data. The table can be substantively updated when the new release’s period, currency and consolidation scope are identifiable. Today’s calculation provides a reproducible answer to how two profit concepts differ; it does not provide personalised buy or sell recommendations.
Original editorial content. Read our editorial standards.
Budapest Global Review: SK hynix: operating profit and net income diverge. Budapest Global Review, 28 October 2026. https://globalreview.hu/en/cikk/sk-hynix-uzemi-netto-eredmenyarany-2026