
In brief
- Marriott's total profit and earnings per share grew at different rates.
- Our calculation shows the role of share count and the limits of rounding.
- Currency, valuation and costs also shape a Hungarian investor's result.
Marriott reported higher third-quarter profit in its November 2 earnings release. Hungarian retail investors should distinguish the company's overall earnings, the amount per share and the return measured in forints in their own account. These are three different calculations, so they can give different answers to the same news.
Earnings per share grew faster
Reported net income in the third quarter of 2026 was 794 million US dollars, compared with 728 million US dollars in the same period a year earlier. Diluted EPS rose to 3.04 US dollars from 2.67 US dollars. Chief executive Anthony Capuano referred to “continued momentum” in the release. This is management's assessment, which we read alongside the numerical comparison.
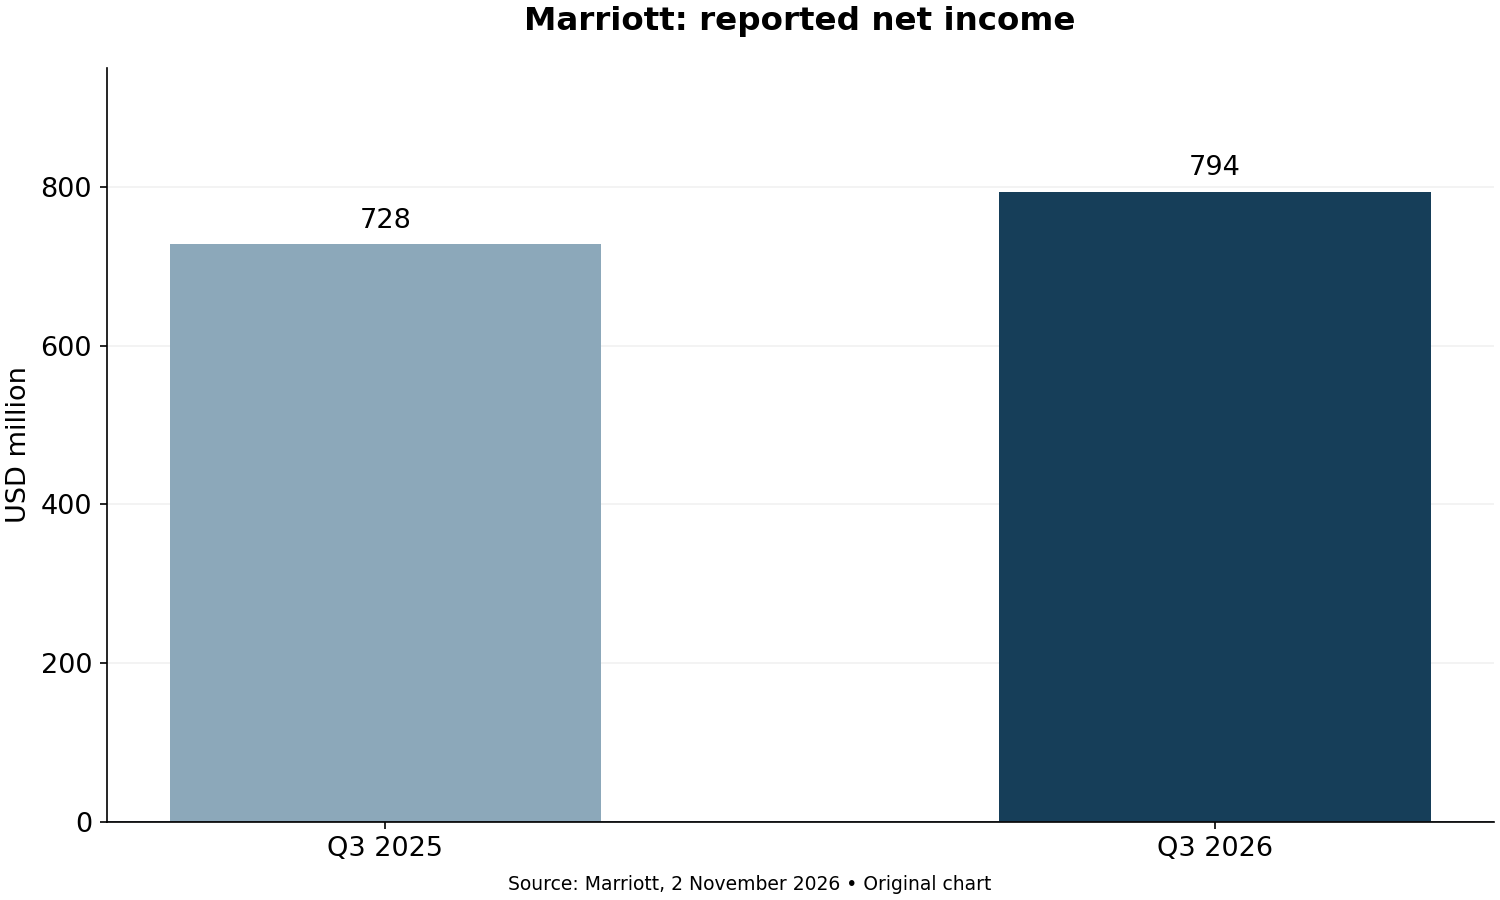
Chart: third-quarter net income, million US dollars; source: company earnings release, our presentation.
Our method divides each new value by the old value, subtracts one and converts the result to a percentage. Profit thus increased by 9.07 percent and EPS by 13.86 percent. We rounded the figures to two decimal places. The annual change in the share count implied by dividing reported earnings by reported EPS is minus 4.21 percent.
This estimate follows from rounded earnings figures; it is not a new disclosure of the actual share register. The ratio approximates the diluted weighted average share count; the number at quarter-end is a different concept. Buybacks, new issuance, share awards and their timing can affect the denominator differently. Our calculation does not isolate each factor's contribution.
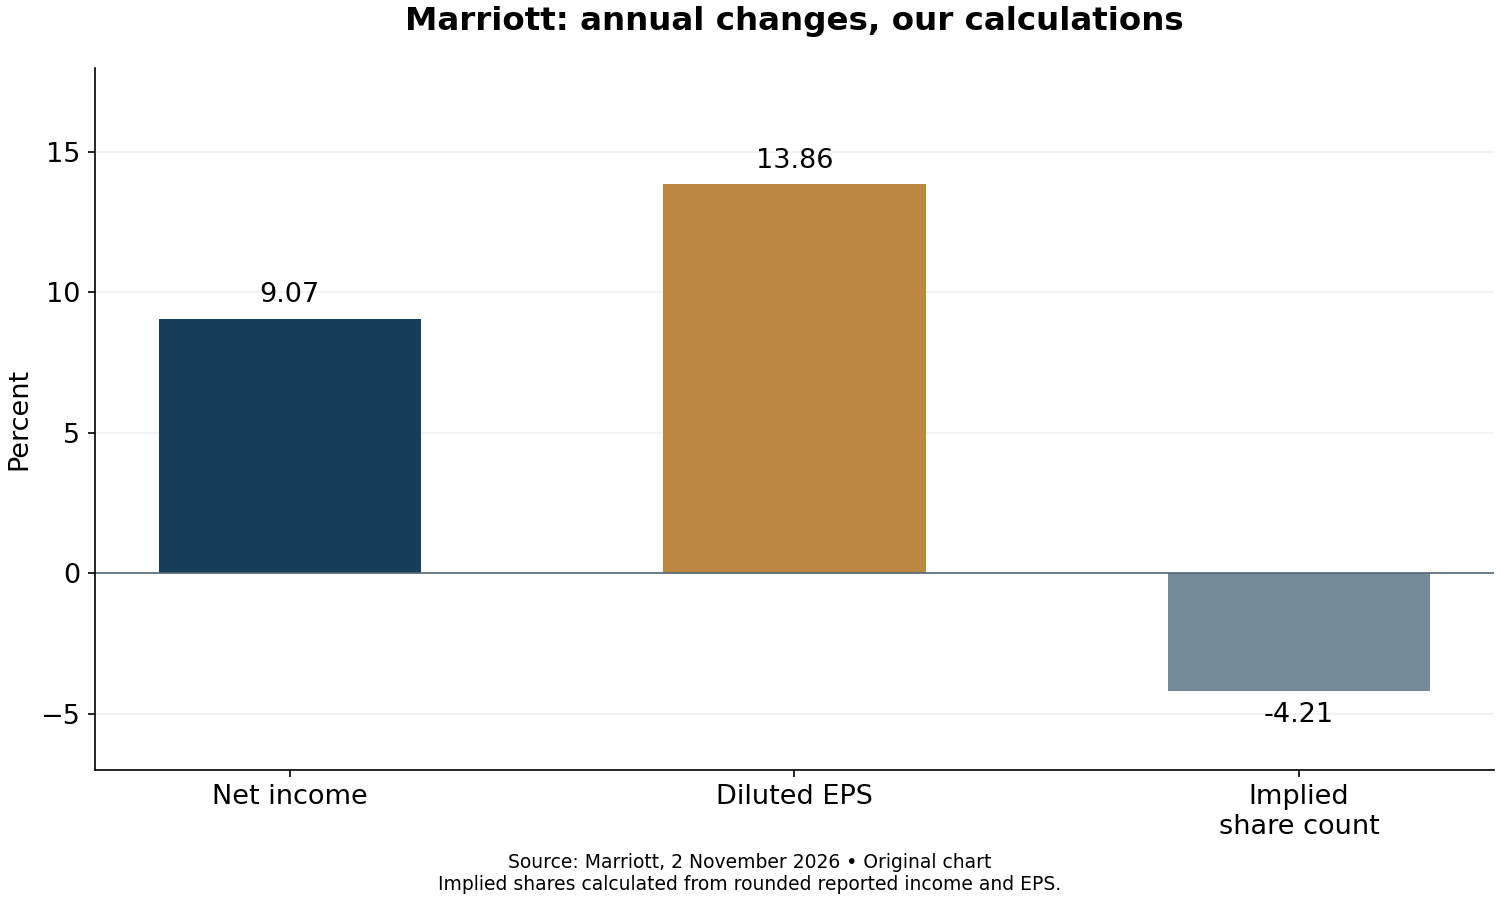
Chart: annual percentage change; source: company profit and EPS, our calculation. Share count is an estimated ratio.
The significance of the different growth rates is that more earnings can accrue to each ownership unit without a similar acceleration in total business profit. The measure remains useful, but answers a different question. Our conclusion is therefore narrow: EPS improvement must be assessed through changes in both earnings and the denominator.
The use of corporate capital is a separate judgement. Buying back shares can reduce the denominator, but also commits cash that could be used for investment, debt reduction or reserves. The quality of such a decision depends on the price paid and alternative opportunities. Rising EPS alone does not establish that every buyback benefited the remaining shareholders.
Earnings and cash can also arrive at different times. Cash for recognised revenue may come later, while an investment's immediate outlay may be recognised as an expense over a longer period. Assessing sustainability therefore requires reading the cash-flow statement, investment needs and debt maturities together. This brief earnings comparison does not provide a comprehensive assessment of those matters.
Geographical composition is another limit on comparison. An aggregate measure for a global network can combine different local changes in demand, currencies and price levels. We therefore do not automatically infer conditions in the Hungarian hotel market from the group figure. Similarly, a photograph of a particular Budapest building is only an illustration: we do not claim that this hotel's revenue or earnings changed at the same rate as the group average presented here.
Outlook, pricing and business risk
According to a separate Reuters report, the company raised its annual revenue-per-available-room growth outlook from 3–3.5 percent to 4.5–5 percent. We treat this as a company forecast, not a realised annual result. We derive neither a share price nor a trading recommendation from it.
Analysing hotel demand requires separate consideration of the number of room nights sold and the price achieved. Higher occupancy can be secured through discounts, while raising prices may reduce guest numbers. The revenue measure is therefore a useful starting point, but without costs and contractual fees it does not fully describe the owner's earnings.
In our favourable scenario, demand holds up, the expenditure required for higher revenue rises moderately, and the increment turns into cash generation. In the adverse version, guests restrain spending and pricing power weakens while fixed costs adjust slowly. These are conditional analytical situations; we have assigned no probabilities to them.
Assessing the share also requires its purchase price. The same earnings growth may represent different value at a higher or lower share price. Shares in an improving company can still lose money if investors previously priced in even stronger growth. Without a verified current share price, we therefore publish neither a valuation multiple nor a price target.
Our analyses of Amazon's cash flow and the bases of Chevron's earnings illustrate comparison problems through other companies. Their different business models mean we do not turn them into a ranking. The common question is the durability and financial backing of earnings.
A forint scenario and a reproducible method
In an illustrative example before costs, the share rises by 10 percent in US dollars while the US dollar's forint value falls by 5 percent. Multiplying the two effects gives 1.10 × 0.95, or a forint-denominated change of 4.50 percent. This is a hypothetical example, not an observed market movement or forecast.
If the US dollar's forint value instead rises by 5 percent in the same example, the result is 15.50 percent, based on 1.10 × 1.05. The difference shows that currency direction can amplify or dampen share performance. A currency-hedged product requires a different calculation and the cost of hedging itself.
The practical net result must also take account of purchase and sale commissions, the currency conversion spread, any account fee and applicable taxation. These can differ by individual and provider. Giving a single net return without a specific fee schedule and tax situation would be inaccurate.
Our methodological check uses the same quarter, earnings definition and currency for both years. We have not mixed adjusted and reported earnings. The charts use scales that include zero; the negative sign of the share-count change is visible. Percentages calculated from rounded inputs have limited precision.
The next substantive document is the published transcript of the investor conference scheduled for November 2. The company's advance notice promised a transcript and a replay. Once it actually appears, management's explanations can be compared with the earnings release figures. We attribute no claims here to the question-and-answer session that we have not reviewed.
Original editorial content. Read our editorial standards.
Budapest Global Review: Marriott: earnings per share grew faster than profit. Budapest Global Review, 2 November 2026. https://globalreview.hu/en/cikk/marriott-nyereseg-reszvenyszam-forintkockazat-2026