
In brief
- Chevron reported higher earnings year on year and lower earnings quarter on quarter.
- The portion of operating cash flow remaining after investment warrants separate examination.
- Currency movements and costs shape a Hungarian investor’s result alongside the share.
Chevron’s earnings release of 30 October reported third-quarter net income of 9,924 million US dollars. For Hungarian retail investors, the comparison base matters: improvement in the company’s earnings and the return on their own HUF investment follow from separate calculations.
Two bases, different pictures
Net income was 12,072 million US dollars in the preceding quarter and 3,539 million US dollars in the corresponding period a year earlier. Our calculation gives an annual increase of 180.42 percent and a quarterly decline of 17.79 percent. Both statements can be true because they use different comparison periods.
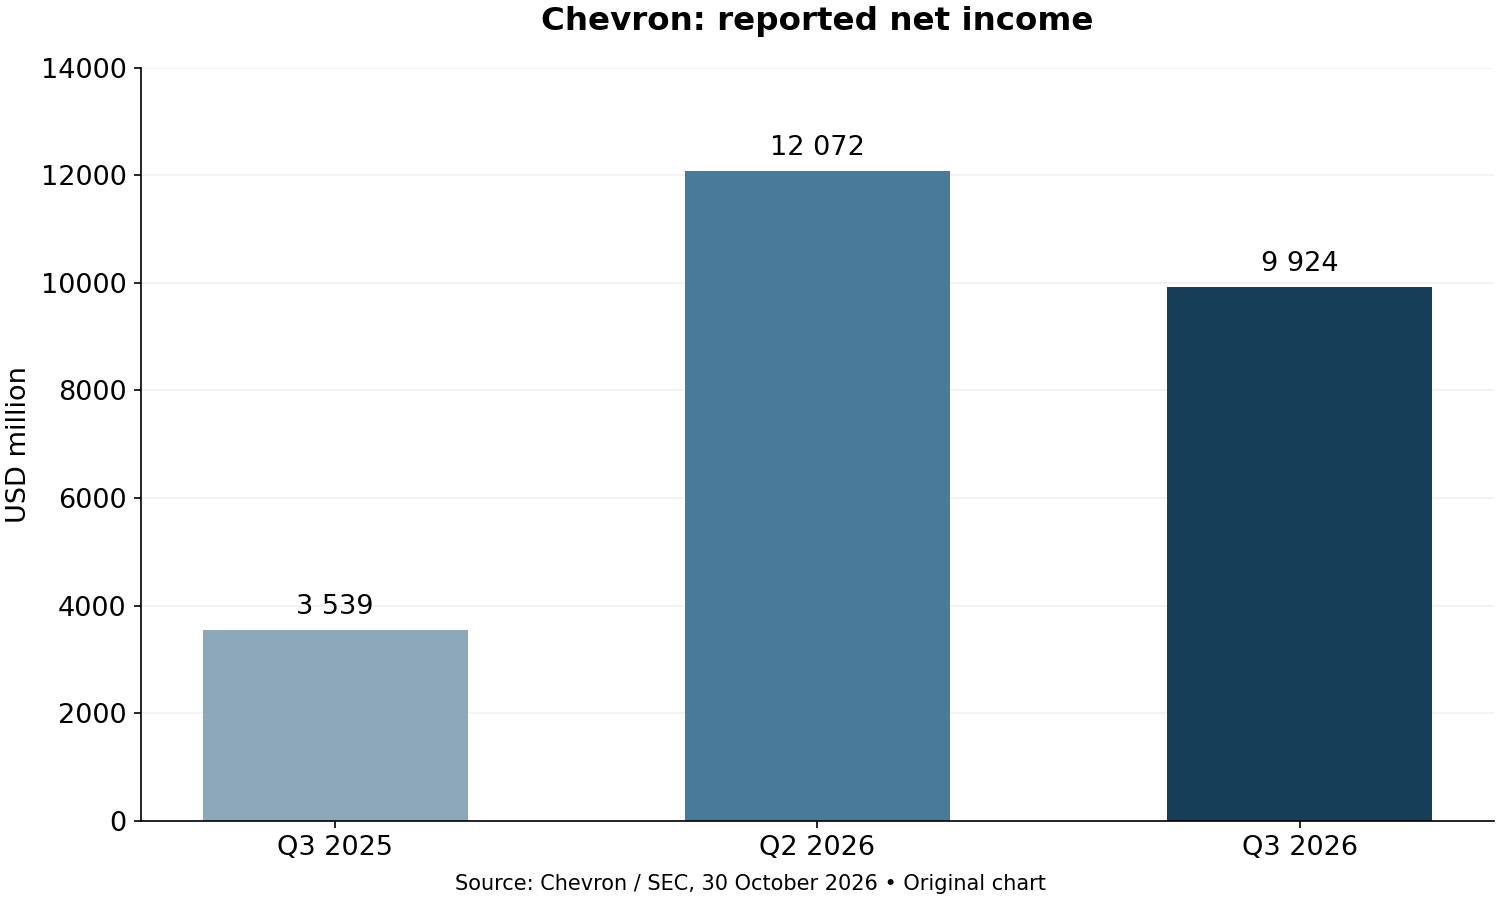
Chart: reported net income, US dollars in millions. Source: Chevron, 30 October; original chart using reported data.
Chairman and chief executive Mike Wirth highlighted “strong operational performance and disciplined execution” in the release. This is management’s assessment, to be read alongside the comparison of figures over time. Strong annual growth does not imply that earnings also accelerated in the latest quarter.
We compared reported earnings using the same concept in every period. The company also publishes a separate adjusted measure, but we did not substitute it for any period in the chart. A comparison is verifiable when readers can repeat it using the same unit, period length and definition of earnings.
Annual and quarterly comparisons answer different business questions. The annual comparison provides a reference against the similar period a year earlier, while the quarterly view shows the more recent change. Inferring a lasting path from a single period is risky: operations, prices and accounting effects can emerge at different times.
Our analysis of ExxonMobil’s results examined similar measurement issues at another company. This does not establish a ranking between the companies: that would require a comparison based on consistently defined measures, business mix and invested capital.
Cash answers another question
Chevron’s third-quarter operating cash flow was 16.0 billion US dollars and free cash flow was 12.0 billion US dollars. Our division puts the latter at 75.00 percent of the former. This is a cash-generation ratio for a particular period, not the share’s dividend yield or a return available to an investor.
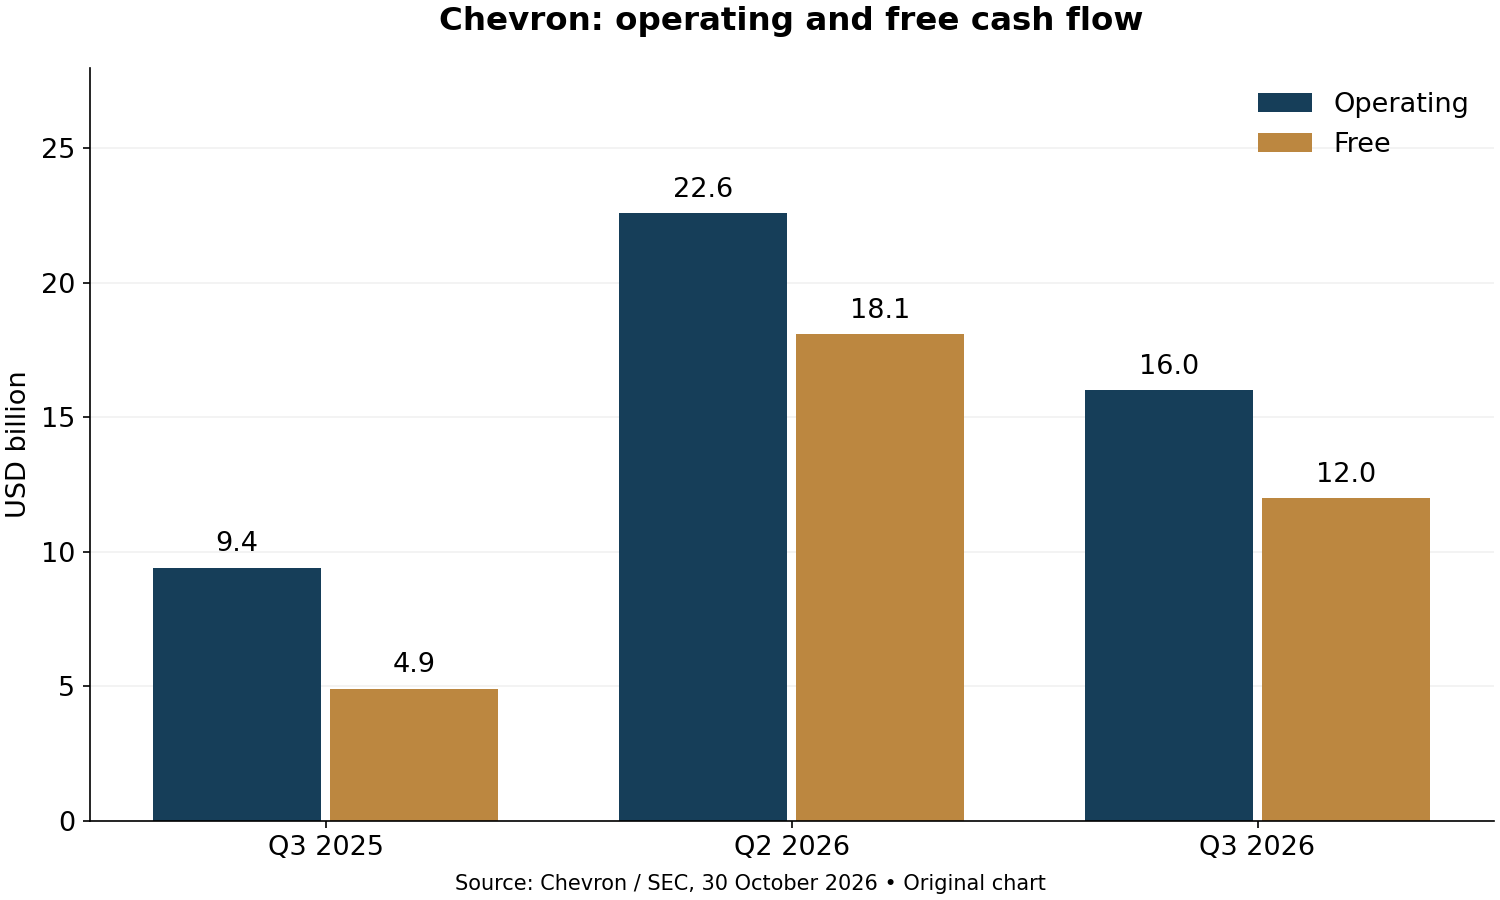
Chart: operating and free cash flow, US dollars in billions. Source: Chevron, 30 October; original chart using the reported, rounded figures.
Free cash flow helps assess the financial room remaining after investment. Further corporate decisions follow: debt management, shareholder distributions or retaining reserves. Using cash and recognizing earnings are therefore different analytical steps.
The timing of customer and supplier payments can also influence quarterly cash flow. A subsequent analysis should therefore examine changes in working capital separately before describing a sustained improvement in performance. The income statement and cash-flow statement provide a useful picture together.
Our methodology calculates percentage change by dividing the new value by the base and then subtracting one. We multiply the result by one hundred and round to two decimal places. For the ratio, we divide free cash flow by operating cash flow; rounding in the underlying data makes this an approximate comparison too.
The charts show quarters of equal length, with axes starting at zero. The earnings and cash-flow charts use different units, so the heights of bars in the separate charts must not be compared directly. Labels and displayed values convey the information together.
HUF, costs and scenarios
For a Hungarian investor, the share return in its currency and the currency movement against the HUF compound. In our illustrative example, which is not a forecast, a 10 percent share-price rise and a 5 percent weakening of the USD against the HUF combine to produce a 4.50 percent HUF return before costs and taxes.
The formula multiplies 1.10 by 0.95 and then subtracts 1. This is a percentage scenario, not a conversion of a cash amount at a current exchange rate. The article gives neither a live share price nor a daily exchange rate, so it cannot indicate an entry price or an expected return.
Brokerage commission, the currency-conversion spread and any account fee can reduce the result. A fixed fee can represent a larger share of a smaller transaction; this must be calculated from the investor’s own fee schedule. Taxation depends on the investor’s circumstances and account, so we do not state a universal net result.
In a favorable scenario, sustained operating cash generation could accompany disciplined investment. In an unfavorable scenario, weaker prices, operational outages or rising costs could reduce financial room. These are conditional analytical paths; the reported quarterly figures guarantee neither outcome.
Nor can the relationship between an oil-sector share and Hungarian fuel costs be derived from a single earnings figure. Corporate business segments, refining and local sales are separate channels. Our article on the European refining dialogue provides regulatory and industry context.
Valuing the share also requires a market price, share count and balance-sheet data alongside earnings. Without these, profit growth does not establish whether the market price is cheap or expensive. This analysis therefore focuses on reading the report and sets no price target. It treats corporate financial performance and investment pricing as separate questions.
Sector concentration also matters within a portfolio. Holding several oil-sector shares can still leave common exposure to energy prices, the investment cycle or regulation. The number of company names therefore does not replace mapping the risk factors. This is a general analytical consideration; the article does not determine suitable weights for a particular investor.
The same definitions and bases should be followed in subsequent reports. If a measure’s calculation changes, the comparability of the earlier time series must be reassessed. The corporate release is a primary data source, but management’s interpretation represents an interested party’s view. We therefore limit our conclusions to reproducible calculations and distinguish conditional risk descriptions from financial facts already disclosed.
The next verifiable corporate event is the dividend payment on 10 December specified in the release; the record date is 18 November. Eligibility must be examined together with transaction settlement arrangements. Our analysis is not personalized advice to buy or sell; it separates earnings, cash and HUF exposure.
Original editorial content. Read our editorial standards.
Budapest Global Review: Chevron: slower cash flow behind strong annual earnings growth. Budapest Global Review, 30 October 2026. https://globalreview.hu/en/cikk/chevron-penzaramlas-nyereseg-forintkockazat-2026